Tentacles that think by Francisco Blaha

Today's is not strictly a fisheries post... but is about one of my favourite sea creatures: Octopus  While I love to eat them,  I'll have to admit that the more I know about them, the harder it gets... Particularly for anthropomorphic reasons, I like people and things that are our of the ordinary... and octopuses are real awesome freaks!

Schematic of Octopus bimaculoides anatomy. Nature 524, 220–224

Schematic of Octopus bimaculoides anatomy. Nature 524, 220–224

Where else would you find an intelligent organism that has a hydraulic skeleton, grab stuff with suckers out of its 8 arms, has the capacity to change  the colour and texture of their skin, moves by jet propulsion, and spits ink when they are upset... common!

The Economist publish recently the results of an interesting paper on some genetical aspects of their intelligence, I quote it below

Almost all intelligent creatures, be they parrots, sharks or human beings, are vertebrates. This is inconvenient for anyone trying to understand the nature of intelligence because it means, by and large, that he can study only how it has developed down a single evolutionary path. But there is an important exception. Molluscs branched off to form their own lineage before any organism had a spine—and one particular class of them, the cephalopods, has since become smart enough to rival some vertebrates.

Modern cephalopods are octopuses, squid, cuttlefish and an unusual shelled creature called the nautilus. Octopuses, in particular, are rated as intelligent. Some carry coconut shells across the seabed to make shelters. Others have worked out that fishing boats offer easy pickings. There have even been cases of them climbing out of aquarium tanks to raid a neighbouring tank that contained a tasty morsel. Many researchers would like to know whether these behaviours have come about in a different way from vertebrate intelligence, or if there are common traits that are necessary for smart creatures of any sort.

Caroline Albertin, of the University of Chicago, and her colleagues have been trying to understand the basis of cephalopod intelligence. To do so, as they report this week in Nature, they have mapped the genome of an octopus species called the California two-spot. They wanted to see which sets of genes in this species were pronounced in comparison to those in other, simpler, molluscs. They found two genetic families that were indeed greatly expanded. One of these, known as C2H2, encodes proteins called transcription factors, which regulate the activities of other genes. The second is the protocadherins, which encode proteins that guide the development of neurons in the nervous system. Both of these gene families are also expanded in vertebrates—but not, as far as is known, in any other group of animals.

Ms Albertin’s co-author, Daniel Rokhsar, of the Okinawa Institute of Science and Technology, in Japan, describes protocadherins as molecular barcodes that identify a cell to its neighbours, enabling appropriate connections to be made. This is vital when building a nervous system. Such a system’s essence is the correct connection between its neurons. Expanding the number of genes for these proteins means they can exist in more diverse forms. In vertebrates this makes it possible for nerve cells to form more complex circuits, and the same is probably true in octopuses.

The effects of the C2H2 genes are less well understood, but having more of them presumably lets octopus genes function in more diverse ways than those of simpler creatures. That would allow a more sophisticated nervous system to develop.

Certainly, the octopus nervous system is sophisticated. It is also different from that of vertebrates, the neurons of which are concentrated in the brain and spinal cord, whence protuberances called axons travel to the rest of the body, to tell it what to do. An octopus brain holds only a third of the animal’s neurons and, being an invertebrate, an octopus by definition has no spinal cord. Instead, the balance of its neurons are concentrated in its arms, which therefore have a curious sort of independence.

This arrangement seems to have come into existence after the split, 270m years ago, that separated octopuses from other cephalopods. The arms of squid and cuttlefish remain under the control of the brain. Each octopus tentacle, however, acts autonomously as it feels around for food or threats. The brain can take over if necessary, but their decentralised nervous systems make octopuses less dependent than vertebrates on transmitting long-range signals through their bodies. That means they can act quickly and instinctively, though at a cost: they can exercise precise control of their arms only by looking directly at them.

With around half a billion neurons, a California two-spot can probably out-think a rat, which has only 200m of them. Yet the decentralisation of its nervous system means the nature of that thinking is surely alien to the vertebrate approach. This, alone, shows intelligence can develop in more than one way. Pursuing Ms Albertin’s approach may help researchers to get their arms around the details.

Original story here

A Pathway to Prosecuting High Seas Criminals by Francisco Blaha

A story the public needs to read

My friend and colleague Mark Young, a former commander of the US Coast Guard that was for a few years FFA operation boss and now is the Senior Officer of conservation enforcement at PewEnvironment, wrote this good piece in Medium website. There he state in clear words some of the key challenges that we face in the high seas; these also indirectly apply to the issues of human rights we are facing in the industry. Furthermore, it shows that there are no easy answers to complicated problems. I quote his contribution below:

These are not high seas criminals, but they always looked dodgy to me :-)

These are not high seas criminals, but they always looked dodgy to me :-)

Ian Urbina’s compelling series demonstrates the complexity of prosecuting crimes committed on the high seas. Criminals have enormous opportunities because vessels spend a considerable amount of time away from land, often beyond the reach of authorities.

And while treaties and laws provide a certain level of governance beyond the jurisdiction of national waters, their rules are often not applied. That’s largely because vessel owners fly “flags of convenience,” which means they have registered their ship in a country whose government has little interest in, or capacity for, holding them accountable.

There are also challenges when citizens of one country are on a vessel bearing the flag of a second country while fishing in the waters of a third country. As I asked in Part 1 of the series, if a crime is committed under these circumstances, “who leads such an investigation?” Who has the authority and jurisdiction? How do victims of offshore crimes get justice?

Trying to answer these questions can be complex and difficult. But following the example of commercial fishing presents an avenue to prosecuting high seas criminals, or at the very least, a penalty for breaking the rules. This can be done by using a set of complementary tools working in tandem across jurisdictions to identify suspicious activity, document the evidence, and take action once a suspected vessel ties up in port. The criminals of commercial fishing are the poachers. Illegal fishing accounts for roughly one out of every five fish taken from the seas, at a cost of up to $23.5 billion every year, according to a study in PLOS One.

The challenge with monitoring fishing vessels, just as with other types of ships, is that thousands of them are spread out over vast ocean regions. Ian points out that the world’s naval presence is diminishing; in any case, a physical presence on the water doesn’t have as great an ability to detect suspicious vessel activity as remote monitoring platforms do. But the challenge with remote monitoring is that not all governments can afford it — which is why platforms such as Project Eyes on the Seas were developed. These tools can give resource-poor regions the potential to identify illegal activity using a range of emerging technologies, from vessel location reporting to satellite imagery.

But what good is this information if there’s no enforcement vessel to catch the suspect ship in the act?

That’s where Port State Measures, an agreement adopted by the United Nations and awaiting ratification by 25 nations before becoming enforceable, comes into play. These measures would allow enforcement officers at any port to use information collected about a ship’s activities at sea to determine if the vessel warrants closer inspection. In the most serious of cases, vessels identified as fishing illegally can be denied port access and services altogether.

International cooperation, even without an official U.N. agreement, has already paid dividends in combating illegal fishing. For instance, in 2012, the Liberian government accused the fishing vessel Premier, flagged to South Korea, of illegally catching tuna in its waters. But by the time the Liberians had enough information to take action, the vessel was gone. When Liberian authorities learned that the Premier was headed for port in Mauritius, they requested that the vessel be boarded and searched, actions that uncovered documents that bolstered Liberia’s case. Ultimately the Premier’s owners settled with Liberia for $2 million.

Once the Port State Measures Agreement is ratified, the international community will have another important tool to deny access to the marketplace for illegal fishing vessels. Combined with tracking technologies and a universal standard for applying unique identifiers to all commercial ships, the increased port enforcement capabilities offered by the agreement have the potential to be a game changer in fighting not only illegal fishing but all maritime crime — because a vessel engaging in illegal fishing is often wrapped up in other nefarious business as well. The more illegal fishing vessels we can drive out of business, the more crime we can combat.

But there’s still a lot of work to be done before most victims of maritime crime get justice. The one common denominator among all the cases Ian uncovered for his series is a lack of leadership in effectively prosecuting those responsible. And that leads to one inevitable conclusion: All of the enhanced technologies and updated laws will have little effect if world leaders don’t prioritize fighting these crimes.

One-year transitional arrangement for the U.S. treaty deal underlines value of Pacific fishery by Francisco Blaha

The one-year transitional arrangement for United States vessels for 2016 is seen as “positive development reflecting the value of rights-based fisheries management” for the Pacific islands

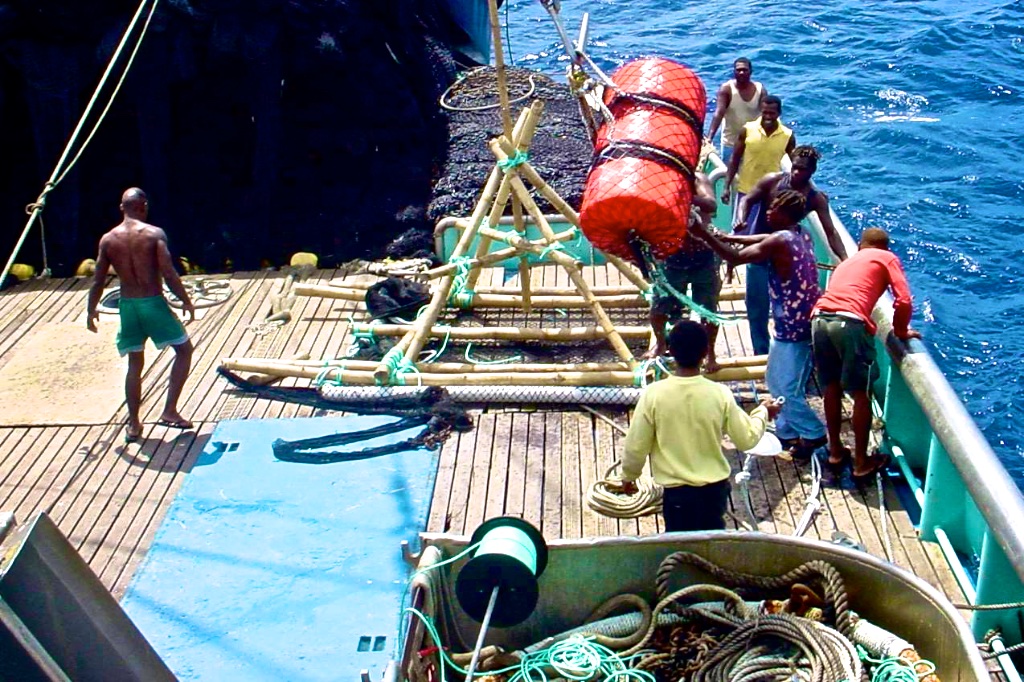
the image has no relation to the tuna treaty, but i really like it :-)

the image has no relation to the tuna treaty, but i really like it :-)

The one-year deal agreed to on 5 August 2015 at the end of a negotiating session in Australia brings greater benefits to all Pacific islands and confirms the value of the PNA’s vessel day scheme (VDS) for managing the skipjack tuna fishery in the western and central Pacific ocean. The deal, however, is only for one year, which underscores the increasing difficulties in getting agreement on longer-term access for U.S. vessels that they enjoyed until the PNA introduced the VDS.

The islands will receive higher fees for fewer fishing days than in the current agreement for 2015. The total package, including both U.S. industry payments and the U.S. government fisheries subsidy comes to US$89,271,350 for 2016.  

The eight PNA members will receive US$12,600 per fishing day, a 34 percent increase over the US$9,380 currently being paid by the U.S. purse seine fleet. PNA set US$8,000 as the minimum fee for VDS days for 2015 and 2016 while capping the number of fishing days for 2015 and 2016 at fewer than 45,000. Many fishing nations in 2015 are paying significantly more than this benchmark price to secure fishing days for their fleets.

In addition, the agreement for 2016 will, for the first time, see the Cook Islands receive significant payments under the VDS, and the U.S. fleet will begin “exploratory” fishing opportunities in the exclusive economic zones of five South Pacific nations.

The U.S. tuna industry will pay US$68,271,350 and the U.S. government will provide a subsidy of US$21 million. Fishing day payments aside, each of the Pacific islands involved in the treaty will receive an equal share payment of US$680,397.

The U.S. also agreed not to fish in two high seas “pockets” located in the PNA region.

PNA has enforced the VDS for the purse seine industry for over five years, setting a minimum fishing day fee now at US$8,000. Since 2010, revenue from the VDS to the eight-member PNA has increased more than five-fold, from US$64 million in 2010 to an estimated US$350 million this year.

Since the access and financial terms of the Treaty lapsed in June 2013, the U.S. and the Pacific Islands have agreed on a series of one-year or 18-month interim arrangements to maintain the treaty, which gives U.S.-flagged vessels access to the region for fishing while negotiating extension of the Treaty.

Although there continue to be challenges — issues such as the U.S. desire for more fishing days in the waters of particular countries and a request for exemption of a few large purse seiners from the requirement that a fishing day be defined as 1.5 days for vessels with significantly increased capacity and sophistication , these issues are to be worked on in the future.

Original source in the PNA page

Status of the World Fisheries for Tuna by Francisco Blaha

The International Seafood Sustainability Foundation, publishes its status of the World fisheries for Tuna and does regular updates.

It tracks 23 stocks of the major commercial tuna species worldwide (6 albacore, 4 bigeye, 4 bluefin, 5 skipjack and 4 yellowfin stocks), and summarizes the results of the most recent scientific as-sessments of these stocks, as well as the current management measures adopted by the RFMOs. In addition, it ranks the status and management of the 23 stocks using a consistent methodology in terms of three factors: Abundance, Exploitation/Management (fishing mortality) and Environmental Impact (bycatch).

They are in a interesting position and get a lot of slack because to 80% of the world’s tinned tuna brands have formed it, with the proclaimed mission of which is to ‘undertake science-based initiatives for the long-term conservation and sustainable use of tuna stocks, reducing bycatch and promoting ecosystem health.’ I guess is up each person's believes to deal with the facts around if a organisation made by fishing companies, can be trusted in the information they provide, even if  the reports are really well referenced from the RFMOs documentations.

Personally, I always believe that if industry is part of the problem, they have to be part of the solution. Hence I welcome their existence, and personally appreciate some of their staff and members. I find the reports quite good, albeit personally I would present some of the graphs and language in a less "massaged" way.

Said so, I really like their "visual approach" to data presentation, for example: their "Colour Ratings Decision Table" as way to present their ranking system.

The latest update (Feb 2015) shows for the Pacific the following picture: 

Where BET is Big Eye, YFT is Yellow Fin, SKJ is Skipjack, ALB is Albacore and PBF is Pacific Bluefin

As you see is a mix picture, but in my opinion is shows firstly the species and elements that need more attention and oversight, and the those where lessons learns in terms of management and compliance can be used.

I'm not saying that things are good (or are going to be good), but that for moving in the right direction we need information, and here is one that helps.


The EU Distant Water Fleet by Francisco Blaha

From 2010 to 2014 at least 15,264 fishing vessels operated under EU flags in external waters using a FAR authorisation. The data has been provided by the European Commission and also includes additional information from 2006 to 2020, amounting to 16,336 unique vessels – including 978 licences that were given to third (or non-EU) countries to operate in EU waters.

This is what WhoFishesFAR, a recently launched website sponsored by a series of NGOs (EJF, Oceana, and WWF) has found after an access of information request to the European Commission. The data includes all official agreements, but not private agreements, as the EU Commission itself admits that the EU has no data on these agreements.

The website is fully interactive and searchable, I recommend you have a go at your key interest areas.

The aim is to share light over the rules governing both the licensing of the European Union’s large fishing fleet operating outside EU waters, and the licensing of non-EU countries’ vessels such as Norway, Iceland and Faroe Islands to fish in EU waters, the so-called FAR, which will be rewritten in 2015. The reform of the FAR must ensure that the activities of the EU fleet and nationals operating outside EU waters are transparent, accountable and sustainable. Otherwise, the EU risks allowing its fleet to be engaged in IUU fishing through legal loopholes. 

Would be interesting to see if there is a correlation in between the difficulties around some of those agreements and the incidence of yellow cards under the EU IUU Regulation.


The Sashimi Tuna Industry in the Pacific by Francisco Blaha

Got good feedback from my post on the canned tuna industry, so under the same "modus operandi" here are my findings on the Sashimi / Longining side of the tuna business in the Pacific. A very different scenario in all accounts, I wish Longliners were only half as regulated and under control as Purseiners are, but we are slowly getting there... at some stage :-)  

Jamie doing the best job he can

Jamie doing the best job he can

Again, lot of the info comes from the great publication by my friends and colleges Hamilton, McCoy, Campling et all "Market and Industry Dynamics in the Global Tuna Supply Chain" published by FFA/DevFISH II in 2011. 

The Players 

Annual tuna supply to the global sashimi market is currently around 500,000 mt, the majority of which is supplied to the Japanese sashimi market (around 80%). The Japanese and Taiwanese longline fleets are the top two suppliers of sashimi-grade tuna, collectively accounting for over half of global longline catches. Other significant longline fleets include Korea, China and Indonesia.

The longline industry is generally characterised by two vessel types – large-scale distant water vessels (supplying frozen tuna) and small-medium scale offshore vessels (supplying fresh tuna). Longline vessels targeting albacore for canning (e.g. Taiwanese, Chinese, PIC fleets) or other species such as sharks and swordfish, may also supply incidental bigeye and yellowfin catch to the fresh sashimi market.

Distant water vessels operate in all three oceans and are typically around 400-500 GRT, significantly greater than 24 metres in length, steel-hulled, have ultra-low temperature (ULT) freezer capabilities (-55-60°C) for storing catch and generally tranship at sea. Smaller-scale fresh tuna longliners usually limit operations to one ocean area and are typically less than 100 GRT, below 24 metres in length, fibreglass reinforced plastic (FRP) or steel-hulled and use ice or refrigerated seawater (RSW) for storing catch, which is offloaded in ports.

Longline vessel numbers in most fleets have declined markedly over the past 5-10 years, in part due to serious profitability constraints stemming from increasing operating costs (especially fuel) and declining catches relating to overcapacity and stock sustainability issues. Further vessel number reductions relate to capacity reduction programs implemented by the Governments of the two largest distant water fleets, Japan and Taiwan, in an effort to reduce global longline fishing overcapacity.

A notable exception is the Chinese fleet which, contrary to vessel number declines in other major fleets (i.e. Japan, Taiwan, Korea), has increased in size, due largely to the purchase of ex-Japanese vessels which had ceased operations due to bankruptcy.

A number of key issues currently impacting longline vessel fishing operations globally include – longline fishing overcapacity, purse seine fishing overcapacity, IUU fishing, stock sustainability issues, rising fuel costs, stagnant prices and market demand, and competition from ranched/farmed bluefin. Large distant water longline fishing operations have been, and continue to be, the most vulnerable to these issues.

Smaller-scale vessels, particularly those capable of multiple targets (e.g. albacore and/or bigeye) have demonstrated greater resilience, as they have more flexibility to adapt to changing operating conditions.

Tuna longline for sashimi is categorized based on type of operation, area fished, and target species:

South Pacific offshore albacore longline fishery comprises Pacific-Islands domestic “offshore” vessels, such as those from American Samoa, Cook Islands, Fiji, French Polynesia, New Caledonia, Samoa, Solomon Islands, Tonga and Vanuatu; these fleets mainly operate in subtropical waters, with albacore the main species taken.

Tropical offshore bigeye/yellowfin-target longline fishery includes “offshore” sashimi longliners from Taiwan, based in Micronesia, Guam, Philippines and Taiwan, mainland Chinese vessels based in Micronesia, and domestic fleets based in Indonesia, Micronesian countries, Philippines, PNG, the Solomon Islands and Vietnam.

Tropical distant-water bigeye/yellowfin-target longline fishery comprises “distantwater” vessels from Japan, Korea, Taiwan, mainland China and Vanuatu. These vessels primarily operate in the eastern tropical waters of the WCP–CA (and into the EPO), targeting bigeye and yellowfin tuna for the frozen sashimi market.

Chinese longliners waiting (for more subsidies?) in Suva harbour

Chinese longliners waiting (for more subsidies?) in Suva harbour

Fleets
Japan

  • Japan’s sashimi market is supplied with catch from the Japanese longline, pole and line and purse seine fleets.
  • The Japanese longline fishery has three major vessel classes – distant water (>120 GRT), offshore (10-120 GRT) and coastal (<20 GRT). Total longline catch (excluding coastal vessels) was 47,199 mt in 2009, with catch volumes declining significantly in conjunction with decreases in vessels numbers.
  • In 2000, 529 distant water longline vessels were in operation; by 2010 this number had decreased to 268. Around 30% of Japan’s distant water longline vessels are profitable; only 100 or so vessels survived since then. In late 2010, there were 275 small offshore vessels (10-20 GRT) and 51 mid-sized offshore vessels (20- 120GRT) in operation. The number of mid-sized offshore vessels has reduced significantly (142 in 2000), while small offshore vessel numbers have remained relatively stable.
  • Japan’s pole and line fleet is comprised of two major vessel classes – distant water (>120 GT) and offshore (20-120 GT). In 2010, the fleet consisted of 26 distant water and 67 offshore pole and line vessels; vessel numbers have decreased over time. Total catch in 2009 was 95,000 mt; a significant decrease from 150,000 mt in 2005. Catch composition has also changed with much higher catch volumes of albacore (i.e. 10% albacore in 2005, 34% in 2009).
  • High fuel prices, as well as the ageing of experienced officers and problems with recruiting young Japanese crew members were identified as the most serious factors which will continue to impact Japanese sashimi fishing fleets in the future.
  • Following the March 2011 earthquake and tsunami, vessel numbers in the coastal longline and pole and line fleets have declined due to wreckages sustained from the natural disaster. Lives of fishing crew members and employees in shore-based tuna businesses have also been lost.

Taiwan

Compliance troubles

Compliance troubles

  • Taiwan’s sashimi-grade longline fishing fleet consists of two classes of vessels - large scale (>100 GT, primarily targeting bigeye) and small-scale (<100 GT, primarily targeting yellowfin). Some of the albacore-targeting longliners of both size classes may also produce sashimi-grade fish from their incidental catch of bigeye and yellowfin.
  • Two major operational characteristics define Taiwan longline activity - the ability to switch target species and in some cases freezing and holding temperature to maximize value of a particular segment of the catch; and, the retention where possible of much of the incidental catch.
  • The number of vessels in Taiwan’s large-scale longline fleet has decreased significantly in recent years – in 2010, the fleet consisted of 359 vessels, a decrease from 562 in 2004. In 2008, an estimated 1,400 small-scale longline vessels between 20-100 GT were in operation and around 500 vessels less than 20 GT. There is also significant Taiwanese ownership of non-Taiwan flag longline vessels fishing for sashimi-grade tunas.
  • The number of Taiwan’s large-scale tuna longline vessels operating in WCPO waters in 2009 was 75, a steep decline from 133 active in 2005. The total bigeye catch for the large-scale fleet was reported to be 8,863 mt in 2009. About 1,220 small-scale tuna longline vessels fished in the WCPO in 2009, catching an estimated 16,500 mt of yellowfin and 4,500 mt of bigeye.
  • Among the two fleets, the large-scale component is the most vulnerable to increased operating costs. Similarly, small-scale vessels are challenged by operating cost increases, but exhibit greater flexibility and are in a better position to adapt to changing conditions in the fishery. The design and construction of small-scale longliners has continued to evolve in recent years.

Korea

  • In 2008, the global Korean longline fleet was comprised of 158 vessels (compared with 276 in 1990), with a total global catch of almost 38,000 mt. Most are large ULT vessels, typically 350-500 GRT in size.
  • In 2009, 111 Korean longliners operated in the WCPO, catching around 31,000 mt; 50% of the retained catch was bigeye and 30% yellowfin.
  • The majority of Korean longline catch is exported to Japan, but increasing volumes are supplied to the growing domestic sashimi market.
  • Vessel numbers in the longline fishery have continued to fall due to increased regulation, increased operational costs and uncertainties regarding the resource base, although vessel numbers are believed to have stabilized for the time being.
  • Given most of the Korean longline catch is taken in WCPO waters, future prospects for the Korea’s longline fleet closely relate to ongoing developments in the region. At-sea transhipment is critical to the viability of the Korean fleet. Hence, Korean vessel owners are particularly concerned about the possible prohibition of at-sea transhipment in the WCPFC convention area.

China

  • Sashimi-grade tuna is produced from two Chinese longline vessel categories - smaller vessels (<30 metres) based in Pacific Island ports, and larger distant-water ULT vessels (up to 70 metres) operating in the Pacific, Atlantic and Indian Oceans. Fiji-based Chinese longliners targeting canning-grade albacore also supply fresh sashimi-grade fish from the last 10-15 sets of a trip. Global bigeye catch by Chinese longliners totalled around 21,800 mt for 2008.
  • About 138 Chinese large-scale distant water tuna longliners operate worldwide. In 2010, 90-100 distant water longliners were active in WCPO waters; an increase from a reported 45 vessels operating in 2008. In 2009, 70-80 small-scale vessels delivered fresh fish to fish bases in FSM and Marshall Islands. Total longline catch by Chinese longliners in WCPO waters in 2009 of bigeye and yellowfin was around 9,800 mt and 6,300 mt respectively.
  • Although distant water longliners do not require extensive support from shore bases, Suva (Fiji) has become the preferred port for re-supply and general support of Chinese ULT longliners, when required. ULT catch by distant water longliners is exported to Japan. Fresh sashimi-grade yellowfin and bigeye from smaller-scale vessels is air-freighted to the Japanese and US markets.

Indonesia

  • Indonesian longline and handline fisheries operate in both the Indian and Pacific Oceans.
  • In 2009, total sashimi-grade catch by Indonesian vessels was around 45,000 mt, 25,000 mt of which was caught in Indian Ocean waters (one-third of late 1990s levels) and around 20,000 mt in Pacific waters.
  • Indonesia has declined considerably in importance as a supplier of sashimi-grade tuna since the late 1990s, particularly with the reduction in Indian Ocean catch. However, it remains a significant source of lower grade frozen sashimi-grade tuna to the US market.

US

  • US longline fisheries in the WCPO are based in Hawaii and American Samoa. In 2010, 156 vessels operated in the region. The Hawaii-based fleet comprised of around 130 vessels, targets sashimi-grade bigeye. The American Samoa-based fleet (26 vessels in 2009) supplies canning-grade albacore, although incidental bigeye and yellowfin may be marketed for sashimi.
  • Total catch of all tuna species by the US longline fleet in the WCPFC convention area was approx 9,000 mt in 2010; a marked decline from 2007 catch volumes of 12,753 mt. Around 4,000 mt of bigeye and 820 mt of yellowfin were caught in 2009.
  • The Hawaii-based longline fleet targets not only bigeye, but also swordfish. A three year closure of the swordfish fishery from 2001-2004 and the subsequent introduction of stricter management regulations has harmed vessel operators’ swordfish and tuna businesses, due to a buyer perception that vessels could not consistently provide product.

Others - WCPO

  • Vietnam’s small-scale longline fleet lands an estimated 15,000 mt (mostly yellowfin), while larger vessels land less than 5,000 mt annually. Vietnam is a significant exporter of fresh and frozen tuna (mostly yellowfin) in various processed forms and was the largest exporter of fresh tuna to the US market in 2009 (2,600 mt, 12% of total US imports).
  • Potential exists to further develop the domestic longline fishery and value-added export processing sector, with recent dramatic growth experienced in these sectors.
  • While the Philippines has a small fleet of less than twenty large distant water longliners, it has a significant handline fishery of around 1,000 vessels (total catch 8,200 mt in 2009; 90% yellowfin). During the 1990s, much of the catch was exported as sashimi-quality fresh chilled whole fish to Japan. However, with the increasing shift to value-added processing (typically CO-treated tuna products), less than 25% of exports are now marketed in whole round fresh-chilled form.
  • In 2012, 97 Fiji-based longline vessels caught approx 15,000 mt of tuna (of which (7,200 mt) was canning-grade albacore;. High quality fresh-chilled bigeye and yellowfin is exported mostly to the Japanese and US markets. Significant quantities of frozen loins also exported to the EU market that is recovering after  Fiji losing EU market access in late 2008.
  • Tonga, Solomon Islands and Papua New Guinea all produce (or have formerly produced, in the case of Solomon Islands) small quantities of sashimi quality tuna for export to the Japanese and US markets. French Polynesia has a large domestic longline fleet (68 vessels), although the majority of catch (80%; ~5,000mt) is utilised for local consumption.

Principal Sashimi Markets

Japan is the world’s principal and pioneer market for fresh-chilled and frozen sashimi-grade tuna, given sashimi and sushi are food dishes which are unique to Japanese cuisine. Until the 1990s, sashimi tuna was almost exclusively consumed in Japan. Today, Japan still remains by far the largest sashimi market, accounting for at least 80% of global consumption.

soon to come to&nbsp;your sushi rstaurant

soon to come to your sushi rstaurant

By comparison, the second most significant sashimi market, the US, accounts for an estimated 8-10% of total sashimi consumption. Annual tuna supply to the global sashimi market is currently estimated at around 500,000 mt; 300,000-400,000 mt of which is supplied to Japan.

An estimated 60,000-100,000 mt is currently supplied to other non-Japanese sashimi markets. The first sashimi markets to develop outside of Japan in the 1990s were the US and Europe (particularly, the UK). Sizeable markets have since developed elsewhere in Asia, with consumption in Korea, China and Taiwan already exceeding that of the European Union.

The growing popularity of Japanese food is also evident in Australia and New Zealand, with a huge boom in the past several years of fast-food retail sushi outlets. Markets are also emerging in Eastern Europe (i.e. Russia) and South America (i.e. Peru and Ecuador).

Japan

  • Japan consumes an estimated 80% of total annual global sashimi production, with a market value of US $3.4 billion (2006 estimate). Sashimi consumption in Japan peaked in 2002 at around 650,000 mt, but has declined significantly since this time; by 2009, annual consumption was an estimated 308,000 mt.
  • An estimated 149,000 mt of sashimi-grade tuna was supplied by Japanese domestic landings in 2009. The remaining supply (159,000 mt) was met from imports from other longline and handline fleets, as well as bluefin tuna ranching operations in the Mediterranean, Mexico and South Australia. Roughly, 30% of total sashimi-grade tuna supply to Japan is fresh-chilled, while 70% is frozen.
  • Since the mid 1990s, sashimi prices in the Japanese market have been depressed due to oversupply. Price stagnation has been further exacerbated by economic recession in Japan and the recent global economic crisis, which has depressed food prices generally and influenced
  • Japanese consumer’s preference for cheaper, lower-end sashimi and sushi products. Competition from cheaper farmed product has also placed pressure on prices.
  • The Japanese sashimi market is characterised by multiple complex market arrangements and distribution systems, but these can largely be distinguished into two channels according to the fresh and frozen sashimi market segments – ‘traditional’ channels (i.e. government regulated wholesale markets systems) and, ‘unofficial’ channels (i.e. more direct marketing channels which largely by-pass the traditional wholesale market system). Historically, both fresh and frozen tuna was marketed through the traditional wholesale market system. This market channel remains significant for high quality fresh-chilled tuna. However, with large advances in freezing technology and development of the cold chain over the past 20-30 years, coupled with the growing significance of trading companies in tuna sashimi trading, there has been a considerable shift in the volume of frozen sashimi-grade tuna sold through unofficial channels, rather than the traditional wholesale market channel. Unofficial channels dominate sales to supermarkets and large retailers (i.e. restaurants, sushi bar chains).
  • Over the past twenty years, Japanese consumers’ purchasing preferences for sashimi tuna have changed markedly. During the economic boom of the 1980s and early 1990s, Japanese consumers’ expenditure on eating out was high and their exposure to, and subsequently, consumption levels of high quality of fresh sashimi tuna increased. However, since the mid 1990s, economic recession prompted Japanese consumers to eat at home much more, which has had a major influence on the rise in supermarket sales of lower-priced and lower quality frozen sashimi-grade tuna. Japanese household consumption of tuna in Japan is in decline, in both volume and value terms. This stems from competition from other protein sources, both seafood and non-seafood. The declining overall trend in sashimi consumption (both in restaurants and homes) is likely to continue given continued low population growth, declining household expenditure on food items generally, and changing consumer taste preferences of the younger generation away from seafood to non-seafood protein sources.

Other Products – Katsuobushi

  • In addition to shelf-stable and fresh-chilled and frozen products, another notable product utilizing tuna, which is unique to Japan, is katsuobushi – flakes or shavings of dried and smoked skipjack (bonito) tuna, used widely in Japanese cooking as a condiment and as a key ingredient in soup broths (dashi) and sauces. The use of katsuobushi in Japanese cuisine is steeped in tradition as its origins date back as early as the Muromachi period (1336-1573).
  • Previously, around 200,000 mt of raw material was required annually for domestic katsuobushi production in Japan. Over the past five years or so, raw material requirements have declined to around 160,000 mt, due to decreasing consumer demand, as well as an increase in the volume of imported katsuobushi products. Japan’s katsuobushi processing industry relies heavily on raw materials caught in WCPO waters by the Japanese purse seine fleet (and to a much lesser extent the Japanese distant pole and line fleet), as well as imported skipjack from other fleets, also operating in WCPO waters.
  • Total annual domestic production volumes of katsuobushi products in Japan in the early 2000s ranged between 35,000-40,000 mt (net finished weight), but have since declined to around 32,000 mt in 2009.
  • Katsuobushi accounts for almost 25% of total tuna consumed in Japan annually. Given katsuobushi products are so culturally ingrained in Japanese cuisine and the market is mature, this relative trend is long-standing and unlikely to change. However, like Japanese canned tuna and sashimi consumption, the actual volume of katsuobushi products consumed annually is steadily declining, due to an ageing population and low population growth.

Longline Transshipment and Unloading Activities in the WCPO

  • No firm transshipment volume amounts are available for the four distinct longline fisheries in the WCPO that unload at sea or in port. It is believed the greatest amount of transhipping at sea takes place in the distant water bigeye/yellowfin target fishery as the practice is an integral part of operations in that fishery.

State of the global market for shark products by Francisco Blaha

After a long wait this publication by my friends and colleges, Felix Dent and Shelley Clarke is available from the FAO virtual library. Is the resource to go to, if you want to know what is happening with sharks and to infer what works and what does not. Download the original from here, (It complements on my shark assumptions post of 4 weeks ago).

Screen Shot 2015-08-01 at 5.22.24 am.png

This publication is intended to complement and inform the International Plan of Action for the Conservation and Management of Sharks, developed in 1998 to address concerns over possible negative effects of increased shark catches on vulnerable shark populations. It is also intended as a part complement to, and part continuation of, Shark Utilization, Marketing and Trade (FAO Fisheries Technical Paper No. 389), published in 1999.

Much of that paper remains valid, e.g. the information on product utilization and processing, as well as that on the biological characteristics of shark species.

Consequently, the present publication focuses primarily on providing an updated picture of the world market for shark products using data that in many cases have only become available in recent years, such as origin and destination data.

Where data are still lacking, an effort has been made to estimate the relevant figures through examination of the trade databases of the world’s major traders of shark products. This increased availability of data is believed to have allowed a more accurate – and up-to-date – initial evaluation of the relative importance of each country or territory, thus providing a more solid basis on which to target investigative efforts.

saved by the camera

saved by the camera

The country-by-country assessments of shark fin trade recording practices also constitute another important area of focus that had not previously been addressed. However, given the primary objective of this study, those details that are necessarily not captured in such a broad-scale review will need to be identified and elucidated in regional or country-specific studies

The Canned Tuna Fishing Industry in the Pacific by Francisco Blaha

I recently was asked to "explain" in a training brief, "how" the tuna fishery aimed at canning operates in the Pacific... a daunting task per se, but one I took as it was good for me to condense a lot of of information I had into one document, so here I transcribe some of the findings. But if you have more up dated data, let me know please and I make the corrections :-) 

from the bridge of a pole &amp; line in the Solomons.

from the bridge of a pole & line in the Solomons.

Thankfully a lot was done on a great publication by my friends and colleges Hamilton, McCoy, Campling et all "Market and Industry Dynamics in the Global Tuna Supply Chain" published by FFA/DevFISH II in 2011. 

Annually, at least 2.5 million metric tonnes of the global tuna catch is destined for canning; the majority of which is caught by purse seine vessels. Given canned tuna is a price competitive and nutritional source of protein, overall demand has increased markedly over the past three decades and remains strong. To match this growing demand, the canned tuna fishing industry has experienced massive growth in terms of vessel numbers, vessel catching capacities and total catch. The level of complexity of the canned tuna fishing industry has also deepened due to factors such as resource sustainability issues, stricter regulatory requirements, increasing operating costs, developments in consumer demand, changing preferential market access regimes, to name a few.

Globally, there are currently at around 580 industrial-scale tuna purse seine (PS) vessels in operation in four major ocean regions - Western and Central Pacific (260), Eastern Pacific Ocean (230), Indian Ocean (50) and Atlantic Ocean (40). Total capital investment in purse seine fishing vessels is in the order of US$ 5.8 billion, representing over 30% of total capital investment in the global canned tuna industry (around US $15 billion).

In the last years there has been significant additional investment in vessels (at least $1.2 billion worth); the majority of new investment being for vessels based in the WCPO. Interestingly, this investment occurred despite increasing operational and regulatory challenges for the tuna industry including overcapacity and sustainability issues, increased regulations and newly introduced fishing restrictions, erosion of tariff preferences, as well as the global financial crisis.

Transhipment in FSM

Transhipment in FSM

The big players in the tuna canning game are:

Fleets
Japan

  • The Japanese purse seine (JP-PS) fleet is stable in terms of vessel numbers and catch volumes – the fleet has been comprised of 35 vessels since 1997 and annual catch volumes consistently exceed 200,000 mt;
  • Japan Fisheries Agency regulation limiting PS vessel size to 1,096 GRT has been relaxed, enabling three companies to trial three new larger vessels (1,800 GRT) with helicopters, in an effort to improve the competitiveness of the Japanese fleet relative to other fleets operating larger vessels (notably, Korea and Taiwan).
  • While a Government regulation has been relaxed which stipulates that JP-PS vessels must return to Japanese ports to offload catch rather than transhipping catch in fishing grounds, most vessels are still opting to return to port at this stage. If the Bangkok skipjack price continues to strengthen relative to the Japanese skipjack market, transhipment volumes will likely increase.
  • The majority of the JP PS fleet’s catch is sold to katsuobushi processors (60%); 20% to low-end sashimi markets (ULT-portion of catch); 10% to Japanese tuna canners; 10% to Thailand tuna canners.
  • In response to PNA countries’ calls for greater domestic investment from DWFN, several fishing companies have established joint venture PS fishing operations in PNG, FSM and Kiribati. Japanese companies are more likely to invest in ‘islandisation’ projects that centre on joint fishing ventures and/or technical cooperation, rather than investing in processing facilities, given negative experiences of Japanese companies in tuna processing investments in the Pacific region in the past.

Taiwan

  • The Taiwanese purse seine fleet expanded rapidly during the late 1980s and early 1990s. Despite the introduction of a Taiwan Government regulation limiting the number of Taiwan-flagged vessels to 34, the fleet has continued to expand through alternative flagging arrangements.
  • In 2014, there were an estimated 60 Taiwanese-owned purse seine vessels operating exclusively in the WCPO - 34 Taiwan-flagged; 20 Vanuatu-flagged; 4 Marshall Islands , 2 PNG flagged; 3 joint ventures (Marshall Islands, Tuvalu). A further 18 Taiwanese-owned vessels operated as US vessels under the US Multilateral Treaty.
  • A long-standing Government prohibition on the importation of used purse seine vessels resulted in the development of a domestic shipbuilding industry in Taiwan that has been able to carefully refine vessel design and size to be economically efficient in purse seine fishing and transhipping in the WCPO. The ongoing success of the Taiwanese purse seine fleet has meant that financing new vessels and operations has not been difficult for experienced operators.
  • Total estimated catch of Taiwanese-owned/controlled vessels was approx. 430,000 mt in 2014 (excluding US-flagged vessels). The majority of catch (90-95%) is marketed to trading companies and transhipped to Bangkok.
  • To ensure ongoing fisheries access in WCPO waters, some Taiwanese vessels owners are forming strategic alliances with PIC-based processors and/or establishing joint fishing ventures in a several PICs (FSM, RMI, Kiribati, Solomons).
  • Taiwanese-owned longline vessels targeting albacore for canning operate in the WCPO, Atlantic and Indian Oceans (estimated total catch of 40,000 mt in 2008). The number of Taiwan’s large-scale longliners has decreased worldwide (359 in 2013), largely due to high operational costs, particularly fuel. Conversely, the number of small-scale longliners has increased (over 2000 in 2012), as they are more fuel efficient and less impeded by Government regulations. An estimated 40 large-scale and 60-80 small-scale longliners targeted albacore in the Pacific in 2012. These vessels utilise port facilities in American Samoa and Fiji for unloading and re-supply, with the majority of catch marketed through trading companies.

Korea

  • The Korean purse seine fleet is comprised of 28 vessels, owned predominantly by three large diversified companies. The fleet peaked at 39 vessels in 1990, but has remained stable at 28 since 2004.
  • The Korean fleet operates almost entirely in the WCPO. In 2009, total catch was a record 280,000 mt – the first year in which Korea has been the highest catching fleet in the WCPO. Catch volumes from 2010 onwards have been affected by high seas closures, while the impact of FAD closures has been less severe than for other fleets, as Korean  vessels fish more on free-swimming schools.
  • Catch is transhipped to Korean ports for domestic processing or to export markets. Annually, around 120,000-130,000 mt is unloaded in Korea. In 2012, 160,000 mt was exported; 80% of which was destined for Thailand.
  • Several ‘islandisation’ projects are underway with PICs – two vessels are reported to be commencing a joint fishing venture with Kiribati; Dongwon (owner of 15 PS vessels and major US tuna brand, StarKist) has been talking of establishing a canned tuna processing facility in the Solomon Islands, but not much has happened so far.
  • Some industry operators are nervous about ongoing access to PNG waters (an historically important fishing ground for Korean purse seine vessels), as Korea has no existing onshore investments in PNG, with related second-generation access arrangements for vessels.
  • In terms of broader fisheries access in WCPO waters, Korea is potentially vulnerable due to the lack of absence of any significant aid programme and a lack of close diplomatic ties with most PICs.

US

  • In the 1980s and 1990s, the US purse seine fleet was comprised of 30-50 vessels. The fleet was deeply affected by international competition and declining fish prices in the early 2000s and contracted significantly to 11 vessels. Since 2007, the fleet has burgeoned again as a result of external investment, with 38 vessels active in the WCPO in 2012.
  • The US fleet is now characterised by two vessel groups – the ‘old fleet’, being US-built and owned vessels which have been historical players in the fleet (18 vessels in 2012); and, the ‘new fleet’ (20 vessels in 2012), being Taiwanese-built vessels which have come under US flag since 2007, under joint venture arrangements between US nationals and foreign investors.
  • US vessels spend the majority of their time fishing in the WCPO, with 40 licences available under the US Multilateral Treaty. Occasionally, US vessels will fish in EPO waters. With fleet re-expansion in 2007, total catch volumes in the WCPO expanded rapidly.
  • Around 20% of the US fleet’s catch is offloaded in American Samoa for processing, mostly by the ‘old fleet’ which is based in Pago Pago. The majority of catch (80%) is transhipped from WCPO fishing grounds to tuna processors in Thailand and Latin America, largely due the ‘new fleet’ utilising the Taiwanese operational model. 
  • The US Treaty expired in 2013 and negotiations have been ongoing between the US Government, US industry and Pacific Island Parties (PIPs) for the Treaty’s renewal. In light of overcapacity in the WCPO purse seine fishery and related sustainability concerns, PIPs have been seeking to apply fishing effort restrictions to US vessels under the Vessel Day Scheme. In addition, PNA members in particular, have been pushing for greater economic returns in the form of domestic development, increased broader cooperation and preferential market access to the US.

Philippines

  • The Philippines has one of the largest purse seine fleets operating in the WCPO – in 2012, 40 large vessels (>250 GRT) and 55 smaller vessels (<250 GRT) were on the WCPFC vessel register.
  • Around 22 large PS vessels currently fish in PNG waters under bilateral access arrangements; a further 18 operate under charter arrangements in PNG (and are regarded as part of the PNG fleet) and eight vessels have re-flagged to PNG. However from 2015 onwards most of the charter ones will be re-flagged to PNG
  • Catch rates of Philippines vessels are significantly lower than those of the larger and more modern vessels operated by other DWF fleets operating in the WCPO (e.g. Japan, Taiwan, Korea). Total catch by domestic vessels in Philippines waters in 2012 was estimated at around 148,000 mt, with a further 71,400 mt caught in PNG waters by foreign access vessels.
  • Catch from Philippines domestic vessels is largely processed by Philippines canneries (around 130,000 mt), with the remaining catch exported to Thailand and possibly, Vietnam. A portion of catch by PNG-based vessels is processed by PNG processors (owned by Philippines investors), with the rest either exported to Philippines domestic canneries and Thailand.
  • The Philippines domestic fleet has been significantly hampered by the loss of access to Indonesia waters in 2007, as well as the recent closure of several WCPO high seas areas.
  • To maintain catch levels, the Philippines fleet is under pressure to find alternative fishing grounds, which will likely see increased fishing in PIC EEZs by existing vessels, as well as additional vessels seeking licences in association with new processing plants (in PNG and the Solomon Islands).

China

  • As China only began to develop its WCPO purse seine fleet in 2001, it is a relatively new player in the fishery. In 2010, Chinese firms owned 16 purse seiners, with twelve registered in China, four in Marshall Islands  and one in FSM. In 2012, total catch by Chinese-flagged PS vessels was approx 77,000 mt.
  • PS fishing companies without direct ties to processing facilities market their catch to the three major trading companies, the majority of which is sent to Thailand. Some catch (~15,000-20,000 mt) is likely sent to China for processing. The Marshall Islands registered vessels will offload a portion of their catch to the newly re-opened Chinese loining plant in Majuro, with the remaining catch sold to a trading company. 
  • While China operates longline vessels in the Atlantic, Indian and Pacific oceans; vessels targeting albacore specifically for canning operate exclusively in the WCPO, using Fiji (Suva) as a primary operating base. An estimated 90 or so Chinese-owned vessels operated from Fiji since 2008, with some fishing in Fiji waters, while others operated outside of Fiji waters (in adjacent high seas areas, as well as Vanuatu and Solomon Islands EEZs), while using Fiji as a base. Total reported catch in 2012 was almost 22,000 mt, with albacore supplied to canneries in Levuka (Fiji) and American Samoa.
  • Most of the impetus for China’s entry and expansion in the tuna industry, both in the WCPO and globally, has come from state-owned enterprises. Government policy is strongly supporting expansion in the agriculture sector, which includes overseas tuna fisheries. Hence, China is a ‘developmental’ mode in terms of the WCPO purse seine and longline albacore fisheries. Given the dominant role of state-owned enterprises there is adequate capital available for expansion and government subsidies (i.e. fuel, shipbuilding) to assist new and existing operations. Fleet expansion, including increased vessel registration in PICs, in some cases in association with joint fishing ventures and processing investments, is inevitable.

Papua New Guinea (PNG)

  • Since 2010, the PNG purse seine fleet (that being, vessels whose catch is attributed to PNG) is comprised of around 45 vessels –  PNG-flagged vessels (fishing in PNG archipelagic and EEZ waters); Philippines-flagged chartered vessels operated by PNG-based processors (fishing in PNG EEZ); and, PNG home-party vessels operating under the FSM Arrangement (fishing in PNG waters and beyond). However many of these vessels have been flagged to PNG during 2015 under the new Tuna Management Plan
  • All vessels are privately-owned, mostly by Philippine and Taiwanese companies with investment in onshore processing and net repair facilities in PNG, as well as fishing/ processing operations elsewhere.
  • PNG’s second generation access agreements link vessels to PNG-based processing plants and other onshore developments, with catch unloading provisions included in the agreements whereby vessels must unload a portion of catch to domestic processors. In 2010, 30% of the PNG fleet’s catch was processed onshore in PNG, with the balance transhipped and exported mostly to Thailand and the Philippines. PNG has a long-term goal to locally process 100% of tuna catch from within its EEZ.
  • PNG is committed to enhancing the value of catch taken from PNG waters through fishing-related onshore investments in processing. As such, fisheries access will be geared even further towards second-generation access agreements where fishing licences will be tightly linked to onshore processing obligations and investments.

EU

  • The EU purse seine fleet is the largest in the world and is comprised of some of the most powerful purse seiner businesses in the world. In 2012, an estimated 88 vessels were owned or controlled by EU-interests; 56 of which were flagged by EU member states (Spain, France and Italy), and 32 (at least) which carried foreign flags. The EU fleet is active in each of the world’s main tropical tuna fisheries; the main fishing grounds being the Eastern Central Atlantic and Western Indian Ocean.
  • The EU is a very minor player in the WCPO, with only four Spanish-flagged vessels actively operating in the region to date under fisheries partnership agreements with Kiribati. Two El-Salvadorian fagged purse seiners (but Spanish owned - Calvo) also fish in Kiribati waters (8,824 mt in 2009). Given the current complexities associated with implementation of the Vessel Day Scheme in the WCPO, EU vessel owners have indicated that they are unlikely at this stage to extend their current levels of activity in the region beyond the existing network of FPAs.
  • EU vessels that are owned by vertically integrated companies supply catch to their processing plants or those with whom they have financial connections, with any surplus catch sold on the global market. Specialised boat-owning companies supply the global market. Given catch by EU-vessels is Rules of Origin (RoO) compliant under preferential trading arrangements between the EU and ACP countries, vessels are generally orientated towards supplying ACP-based tuna processing facilities.
  • EU import tariffs and preferential RoO are central to the commercial survival of the EU fleet. The provision of ‘global sourcing’ RoO for processed tuna under the P-ACP Interim EPA is a deep source of concern for the EU fishing and processing sectors. 

Indonesia

  • In contrast to other large industrial tuna purse seine and longline fleets operating in the WCPO, Indonesia’s tuna fisheries are largely artisanal in scale and multi-gear/multispecies by nature. Commercial-scale purse seine and longline vessels account for only 3% of the total number of inboard-powered vessels (~200,000 vessels).
  • In 2012, approx 180 commercial-scale purse seine vessels (<2,000 GT) were licensed to fish in two Fishery Management Areas in Indonesia’s Pacific EEZ waters. There is very little fishing outside domestic waters by Indonesian vessels by virtue of their generally small size and limited range.
  • Production figures for Indonesia tuna fisheries are generally incomplete or uncertain due to the difficulties of monitoring catch and effort artisanal vessels offloading to multiple landing points. Total purse seine catch in 2009 may have been in the order of ~190,000-200,000 mt.
  • An increasing volume of catch is processed locally by tuna canneries (~90,000 mt/year), and smaller volumes are smoke-dried for katsuobushi production. Catch is also exported to Thailand and Vietnam-based processors.
  • Since production levels and exports cannot be quantified with any level of certainty, it is difficult to ascertain Indonesia’s significance in the canned tuna supply chain. Indonesia remains an important middle-level supplier of raw material to WCPO canneries and its own growing domestic canning industry, but no major increases in supply is anticipated in the short term.

Other Fleets – EPO

  • In 2012, there were 220 licences purse seine vessels operating in the EPO. The two largest fleets in the region are Ecuador and Mexico, each comprised of 40-50 vessels.
  • Both fleets primarily supply domestic processing industries, which are also the two largest processing countries in the EPO. Panama and Venezuela have fleets consisting of 20-30 vessels each, while Colombia has 11 vessels. Nicaragua, Peru, Vanuatu, Spain and Honduras (mostly spaniush owned) each have less than 10 vessels operating in the EPO fishery. Current total purse seine carrying capacity in the EPO is the highest in history (~212,000 m3).
  • Total skipjack catch in EPO waters (for all gear types) was around 305,000 mt in 2008. In 2012, skipjack catches reached a record low, resulting in EPO processing plants sourcing a considerable volume of raw material from the WCPO.

Others Fleets – WCPO

  • In 2012, the Solomon Islands fleet consisted of five purse-seine vessels and three pole&liner, which supply Soltuna processing plant based in Western Province. They produce for the local and regional markets as well exports of cooked loins to Italy and Spain
  • Catch over and above Soltuna requirements is transhipped and exported to other markets.
  • With productive skipjack resources and encouragement from the Solomon Islands Government for onshore investment, there may be more locally-based purse seine fishing and processing developments in the near future.
  • The FSM purse seine fleet consisted of seven vessels in 2010, five of which have FSMA status. Total catch in 2009 was 19,143 mt, but much of this catch was taken outside of the FSM EEZ, given five vessels are licensed to fish in other PNA members’ EEZs. All catch by FSM vessels is exported to Thailand.
  • In 2010, the Marshall Islands (RMI) fleet consisted of eight purse seine vessels, five of which were licensed under the FSMA. In 2010, total catch was around 44,000 mt. The fleet will increase to ten vessels in 2011, with an additional two vessels (of a total of four licences) commencing operations in conjunction with the recently re-established loining plant in Majuro, which is now owned and operated by Chinese interests (Pan Pacific Foods (RMI) Ltd.). While some of the fleet’s catch is processed by the loining plant, the majority of catch is exported for processing elsewhere (i.e. Thailand, Philippines, Japan).
  • In 2010, 19 purse seine vessels were Vanuatu-flagged, although 13 of these were classified as PNG home party vessels under the FSMA (with catch attributed to PNG).
  • Vanuatu’s vessels are generally owned by Taiwanese investors and are some of the most efficient in the entire WCPO fleet. Total Vanuatu PS catch in 2009 was around 38,000mt; all of which was transhipped. In 2009, four vessels switched to US flag to operate under the US Treaty.
  • The Kiribati purse seine fleet consisted of five vessels in late 2010, comprised of three vessels of Ecuadorian origin and two Japanese joint venture vessels. With the introduction of the Ecuadorian vessels in 2009, total catch increased from 6,000 mt in 2009 to over 21,000 mt in 2009. Prior to 2009, the entire Kiribati PS catch was exported to Thailand. Now, the catch from the three Ecuadorian vessels is exported mostly to Ecuador-based processors.
  • Four New Zealand vessels were licensed to operate in the WCPO, with a recorded catch of 26,600 mt in 2012. The majority of catch is unloaded in Pago Pago, with small volumes exported to Thailand and other markets via Majuro. From 2015 onwards the the NZ fleet is only two vessels.

Longline-Caught Albacore for Canning

  • The estimated catch of albacore in the WCPO was 120000 mt in 2012. Longline catches comprised close to 70% of this total. Taiwan and Vanuatu (Taiwan owned) vessels accounted for the largest share of longline albacore catch, closely followed by China and Japan. 
  • PIC-flagged fleets (mostly foreign owned) operating in the South Pacific albacore fishery also made a significant contribution to the WCPO catch (i.e. Fiji, Samoa, Tonga, Cook Islands) (around 65,000 mt in 2012). 
  • Most of the albacore longline catch is destined for canning, with the US being the primary market. Some at-sea transhipping occurs for export to Thailand, as well as unloadings to processing plants in Fiji, American Samoa and French Polynesia.

Canned Tuna Trading Companies – The ‘Big Three’

In the simplest sense, tuna trading involves the procurement of raw materials from multiple fishing vessels and coordinating transhipment of catches into reefer carriers for sale and delivery to tuna processors. Canning-grade tuna    trading companies have grown to a position of relative dominance in the supply chain, largely due to the effectiveness of the services offered to vessel owners. Engaging a trader enables vessel operators to channel their energies into fishing, rather than having to deal with the financial, administrative and logistical hassle and risk associated with marketing catch.In the case of processors, purchasing raw material from tuna traders removes the complexities of dealing with a large number of vessel owners selling small volumes of catch. Working with trading companies also ensures that processors have continued access to large volumes of raw material. Tuna trading is a highly competitive business; as limited profit is made per shipment, trading companies capitalise on economies of scale and attain profits through trading high volumes of product.

Unloading in General Santos - &nbsp;Philipines&nbsp;

Unloading in General Santos -  Philipines 

Three major companies dominate canned tuna trading activities in the WCPO - Tri Marine, Itochu and FCF Fishery Co. Ltd. Collectively, these companies handle annually over 1,350,000 mt of raw canning material; around 70% (900,000 mt) of which is sourced from vessels operating in the WCPO.

Of the three companies, FCF handles the largest volume of raw material (around 650,000 mt per year) and is by far the most prominent tuna trader in the WCPO region. While Tri Marine handles lower volumes than FCF (500,000 mt/year), it has a much stronger global presence (especially in the European market and other oceans) and has a more vertically integrated business model. Itochu is the most conservative of the three, operating almost exclusively in the WCPO and trading the smallest volume of raw material (200,000 mt annually).

The canned tuna trading business in the WCPO grew significantly in the 1980s, largely in conjunction with the development of Thailand’s tuna packing industry. Tuna traders established an integral role for themselves since WCPO fishing grounds are located a fair distance from Bangkok and Thailand did not have an established domestic purse seine fleet from which to source raw material, nor a sufficiently sizeable local market for finished product. Originally, there were 20 or so trading firms supplying raw material to Thai processors. However, by the mid 1990s, FCF, Tri Marine and Itochu emerged as the dominant players and nowadays, collectively supply Bangkok-based tuna processors with around 80% of their raw material needs.

The ‘Big Three’ tuna traders have established an integral position for themselves in the WCPO tuna fishery and, to an extent; the global canned tuna supply chain as a whole. Their position is unlikely to change or be challenged anytime soon given their well established long-term relationships with fishing and processing clients, strong financial backing to fund trading transactions and sophisticated market intelligence systems. It is unlikely that any new trading companies could enter the market and compete with FCF, Tri Marine and Itochu in the WCPO.

Canned Tuna Processors

The contemporary global canned tuna processing industry developed in the mid 1950s, in conjunction with the development of industrial-scale tropical tuna fisheries, with significant growth experienced in the late 1970s-early 1980s. Originally, the US mainland, EU and Japan were the dominant canned tuna processors. Commencing in the early 1980s, with the development of tuna canning industries in the Philippines and Thailand, and later in other lower-cost production sites in South East Asia, Central/Latin America and the Indian Ocean, the dominance of the former three major producers diminished. Today, global canned tuna production exceeds 1.7 million metric tonnes (net finished weight) annually.

Globally, there are at least 144 tuna processing facilities in operation producing canned tuna products and/or frozen cooked loins. In 2008, global maximum processing capacity was around 14,220 mt/day of raw material and estimated annual production was 3.05 million mt (whole round equivalent). Currently, Thailand processes almost one-quarter of the world’s canned tuna (736,000 mt in 2008). The second largest processing site is Ecuador which accounts for almost 12% of global annual production (362,400 mt in 2008).

Total global capital investment in canned tuna processing facilities is estimated to be around $1.3 billion. In 2009, it was estimated that new capital investment in processing facilities over the three years prior was around $0.5 billion, around 40% of which went into onshore investments in the WCPO region ($186 million).

Developing world players have risen in dominance in the past 20-30 years due to these countries’ ability to achieve economies of scale, as well as other factors including some sites being located close to major fishing grounds, having access to productive and lower-cost labour sources, and in some cases, preferential access to the major canned tuna markets (EU, US). High-cost processing locations (i.e. US, EU) are increasingly switching to using frozen cooked loins for canned tuna production that are sourced from lower-costs sites of production (or outsourcing
production altogether) where labour costs are considerably less.

Like the canned tuna fishing industry, the canned tuna processing industry is both complex and dynamic. Global processing operations are currently influenced by factors such as increasing cost of raw materials and other production inputs, tuna resource sustainability issues, overcapacity, complex tariff regimes, increasingly stricter standards (i.e. labour, quality, food safety and environment) and changing consumer preferences.

Tuna Plant&nbsp;

Tuna Plant 

Thailand

  • Thailand is the world’s leading producer of canned tuna and global price market leader for canning-grade whole round frozen tuna. Over the past 30 years, Thailand’s tuna canning industry has grown exponentially, with annual total production of canned tuna and cooked loins now exceeding 700,000 mt.
  • In late 2010, there were 30 canned tuna processors operating in Thailand; with a total combined annual processing capacity of 3,000 mt/day. Facilities are currently operating at around 85% capacity (2,500 mt/day).
  • The industry is dominated by two large-scale processors, Thai Union (1,000 mt/day) and Sea Value (850 mt/day). Several medium-scale operations process around 300 mt/day (or less), with the remaining processing firms being mostly small companies.
  • Around 85% of raw canning material for processing is imported by Thai tuna processors. The majority of raw material is sourced from the WCPO (~90%) through trading companies. Thai canners experience difficulties attracting Thai workers and rely heavily on migrant labour from Burma (50-60%). The most significant markets for canned tuna exports from Thai tuna processors are the US, EU Middle East, Australia and Canada.
  • The most notable recent industry developments include the takeover of major EU processor and brand owner, MW Brands by Thai Union and Thai Union’s investment in a joint processing facility in Lae, PNG.
  • Given Thailand’s huge processing capacity and related economies of scale, global competitiveness, industry know-how and market share, it will continue to dominate the global canned tuna processing industry. The industry is considered to be relatively stable; it is unlikely that there will be any new entrants in the short-term.

US – Mainland

  • The US was the first and the largest contemporary tuna canning industry in the world.
  • As low cost competition emerged from Southeast Asian countries, the US switched production to the US territories of American Samoa and Puerto Rico to combat high wages and strict environmental regulations on the US mainland. Since 1979, twelve canneries based in the US and its overseas operations have closed.
  • In 2010, there were two tuna canneries operating in mainland US – Bumble Bee (Santa Fe Springs) and Chicken of the Sea (Georgia). Both plants only process cooked tuna loins in highly productive, capital intensive production systems. In 2010, total combined maximum processing capacity of the two US mainland facilities was 60,000 mt of frozen loins.
  • The US has three major branded tuna processing firms - Bumble Bee Foods, Chicken of the Sea International and StarKist Seafood Co; each of which have investments and/or managerial control over processing plants in third countries.
  • The WCPO is a critical source of supply for the three major US brand firms.
  • The vast majority of product produced by the US ‘big three’ is destined for the North American market, primarily the US. The ‘big three’ brand labels command upwards of 80% of the US market.

US – American Samoa

  • In the 1950s, Chicken of the Sea International and StarKist invested in processing plants in American Samoa (Pago Pago). With production capacities of well over 100,000 mt per annum each, the plants were two of the biggest operators globally. One of American Samoa’s major strengths has been in the processing of high value albacore (white meat).
  • Canned tuna processed in American Samoa is destined for the US market, as it enters duty free.
  • Beginning in the 2000s, the Pago Pago plants began to lose their competitive edge as wage costs were far higher than competitors in Asia and Latin America. In 2007, minimum wage legislation was passed in the US, requiring American Samoa to incrementally increase wages by more than double. This was a significant blow to the two canneries and a major contributing factor to Chicken of the Sea closing its plant in 2009 and relocating to the US mainland (Georgia).
  • StarKist remains operational, but is making significant changes to its production system to remain as competitive as possible, including reducing its labour force and processing increasing volumes of loins. In 2010, StarKist processed 70,000 mt of skipjack and 32,000 mt of albacore.
  • The former-Chicken of the Sea facility was purchased by Tri Marine in October 2010 and will recommence operations (under the name of Samoa Tuna Processors Inc.), albeit processing smaller volumes under a completely different business model.
  • The Government of American Samoa was attempting to protect its canning industry through the proposed Protection of Industry, Resources and Employment (ASPIRE) bill, which if passed by the US Congress, would subsidise tuna processors in Pago Pago. However, Aspire never happened.
  • Tri Marine's cannery in American Samoa is now up and running and is ramping up production. The battle now is preserving access to productive fishing grounds in the Western and Central Pacific for the American Samoa based U.S. flag fleet.  Without access to nearby EEZ's, the American Samoa purse seiner fleet will have to relocate and become a transshipment fleet just like the rest of the U.S. fleet, the one that is joint ventured with Taiwanese interests and managed effectively in Taiwan. (Thanks Joe Humby for the update! 09/08/15)

EU

  • The most important canned tuna processor in the EU is Spain, which accounted for around 60% of annual EU canned tuna production from 1998-2007. In 2012, Spanish production was approx.  230,000 mt.
  • There are five major Spanish processing firms (Calvo, Jealsa, Frinsa, Garavilla and Salica); four of which own their own fishing capacity. A further four major non-Spanish companies are also involved in canned tuna production (Bolton, Princes, MW Brands and Thunnus Overseas Group); only one of which is owned by ‘European’ capital (Bolton).
  • Given relatively high labour costs in the EU, considerable attention is paid to labour time/ cost and fish yield; canneries source large-sized whole round fish (i.e. yellowfin over 10 kg) to enhance labour productivity through high recovery rates (average 48.5%).
  • Investment in processing facilities in the developing world (i.e. Sub-Saharan Africa and Ecuador) is central to the production strategy of most EU-based firms and is closely connected to EU trade preference schemes.
  • The vast proportion of canned tuna processed in Spain, Italy, France and Portugal are sold within the European Union.
  • The survival of EU-based canned tuna processing firms will continue to depend on tariff protection against relatively low cost imports and cost-reduction strategies. Some of the major Spanish players are moving away from a focus on market share growth to increasing operational profitability, and as such are focusing increasingly on value-added products to minimise the impact of rising raw material price.

Ecuador

  • Ecuador is the most significant canned tuna processing player in the Americas, with a total daily maximum raw material processing capacity of 1,865 mt/day (~450,000 mt annually). In 2012, there were approximately 18 processing plants located in Guayaquil (1), Posorja (1) and Manta (16). In 2012, Ecuador processed around 360,000 mt of raw material, making it the world’s second largest producer behind Thailand.
  • In 2010, plants in Ecuador were suffering from supply constraints (both overall and of RoO-compliant fish) due to poor catches in the EPO (an estimated 40% lower than 2009 catches). Plants undertook several strategies to respond to supply shortages – operating at below capacity and extending planned maintenance closures, expanding cold storage capacity to stockpile raw material, and importing larger volumes of fish (mostly from WCPO).
  • Two critical factors are cited for Ecuador’s success in canned tuna processing - an efficient, productive and stable labour force, and in the case of several plants, vertically integrated business models including purse seine fishing operations.
  • Ecuadorian processing plants produce primarily for the EU and US markets; it is the top volume supplier of tuna loins into the European Union (mostly to Spanish and Italian canned tuna processors)
  • There is also increasing production for the growing Latin American market. Ecuadorian processors are interested in expanding supply for the regional market, in part to reduce their dependence on sourcing RoO compliant fish for the EU and US markets.

Philippines

  • Philippines’ canned tuna processing industry developed during the late 1970s and 1980s and it has become the second largest processor in the WCPO, following Thailand. Seven canneries are currently in operation (six of which are based in General Santos).
  • In 2009, annual production was ~220,000 mt (daily processing capacity 850 mt/day); a reduction from a peak in 2006/07 of 250,000 mt.
  • Several of the canners are part of vertically integrated operations, sourcing at least some of their raw material requirements from their own company fleets in Philippines or overseas (PNG, and formerly, Indonesia).
  • The majority of Philippines cannery production is exported, mostly to the EU and US market (10.4 million cases (83,604 mt) in 2009), with around 10% of canned tuna consumed locally.
  • Production in domestic Philippine canneries seems unlikely to expand due to raw material supply problems (i.e. declining domestic catches and reduced access to Indonesian waters). Any strategy for major expansion in production capacity will more likely involve the construction of new processing plants elsewhere in the WCPO (i.e. PNG, Indonesia).

Korea

  • The establishment of the Korean tuna canning industry is a relatively recent development, beginning in the early 1980s.
  • There are currently five major Korean canneries in operation, with a combined daily processing capacity of 500 mt. In 2009, total annual production was around 125,000 mt. Production is entirely for domestic consumption.
  • All fish currently processed in Korean canneries is sourced from catches in the WCPO by the Korean purse seine fleet. Two of the canning companies are vertically integrated operations with their own fishing vessels (i.e. Dongwon and Sajo).
  • The most significant recent industry development has been Dongwon’s acquisition of StarKist from Del Monte Foods in 2008.
  • Future growth in the Korean domestic processing sector is possibly limited. Any expansion of Korean processing capacity will likely be linked to the establishment of overseas operations, with export rather than domestic markets to be found for the product.

Japan

  • The Japanese canned tuna processing industry was originally export-orientated, supplying the US market primarily. Due to rising competition from lower cost sites of production, Japan’s canned tuna processors changed their focus to produce exclusively for the domestic market.
  • Since the mid-1980s, canned tuna production in Japan has declined markedly due to diminishing consumer demand, and increased competition from cheaper imports of finished production (mostly from Thailand).
  • In 2008, fourteen canned tuna processors were operating in Japan, with a combined raw material processing capacity of 400 mt/day (annual production of ~80,000 mt).
  • Japanese canners mainly source raw materials (whole round and loins) through the major tuna trading companies. Catch sourced from Japan’s purse seine fleet currently only accounts for around one-quarter of production (20,000 mt annually).
  • Japanese canned tuna production is entirely for domestic consumption and is a high quality market. Hagoromo Foods Corporation, Japan’s pioneer canned tuna processing company (est. 1931), dominates domestic canned tuna production and its ‘Sea Chicken’ brand claims 60-70% market share.
  • Japan’s domestic canned tuna production is likely to increasingly shift to offshore locations (either through Japanese investment in offshore facilities or increased sourcing of finished product from overseas supplies), due to several issues impacting on the competitiveness of Japan’s processing operations – labour cost and availability, strict environmental standards, stagnant consumer demand, and increased competition from Thai imports.

China

  • Canned tuna processing in China represents a very small fraction of the country’s large and active export-driven fish re-processing sector. Processing is primarily undertaken by the private sector; the large state-owned enterprises engaged in tuna fishing do not appear to be directly engaged in the processing sector.
  • Obtaining a clear picture of the sector (in terms of the number of facilities and raw material sources and processing volumes) is difficult due to China’s commodity tracking system.
  • In 2010, two tuna processing facilities were likely in operation, processing between 30,000–50,000 mt of raw material.
  • The US has been the largest market for canned tuna from China for the last several years\ (6,000 mt in 2009). There appears to be a general trend towards increased production and exports of loins, with exports to EU processors reportedly increasing by 300% from 2007-2009 (4,400 mt in 2009).
  • The major problems confronting China’s tuna processing sector are similar to those facing the country’s fish processing sector in general - increasing labour costs in a labour intensive industry, as well as rising land, water and energy costs as China’s economy develops, particularly in coastal cities.
  • Given these constraints, coupled with a very limited domestic market for canned tuna, it is unlikely that China will become a major tuna loining or canning centre, in the same way as it has become a significant player in other manufacturing industries in recent years. No one geographic centre has emerged for tuna processing, which limits the opportunities for gaining economies of scale, an important factor in counteracting rising costs.

Indonesia

  • The Indonesian tuna processing sector is showing clear signs of resurgence, after a period of decline in the late 1990s and early 2000s. Prior to this, over twenty tuna canneries were in operation.
  • In 2010, there were at least thirteen canneries in operation with an estimated annual throughput of around 100,000 mt. The supply of raw material to Indonesian canners is almost fully sourced from local vessels.
  • Canned tuna production is predominantly for export, with minimal local demand. Canned product is exported to a wide range of markets including the EU, US, Japan and the Middle East.
  • The revitalisation of canneries in Bitung is a major development for the Indonesian canned tuna processing industry, with three plants commencing or expanding operations] in 2008-2009. A fourth plant is scheduled to open in 2011 and an inactive plant may also resume operations in the future. It is unclear whether Indonesian canning capacity will continue to grow beyond the current period of resurgence.

Vietnam

  • Tuna canning and processing capacity in Vietnam has developed since the early 2000s, in parallel with processing of product for export markets from its very large aquaculture industry.
  • There are three main privately owned tuna canners based in the Mekong Delta area; two of which are owned by overseas interests (Thailand, US). Other small seafood processors may also occasionally process small volumes of light meat. In 2009, Vietnam’s estimated production was 50,000 mt.
  • The US and EU markets collectively accounted for close to 70% of the total value of exports in 2009. There is also a small local market for canned tuna.
  • Vietnam’s major strength is its cheap and highly productive labour force. However, there is some pessimism about Vietnam becoming a significant canned tuna processing site in future, given several constraints, including the heavy reliance on imported raw material,
  • comparatively higher freight costs, a restrictive bureaucratic environment and lack of economies of scale.

PNG

  • PNG’s first canned tuna processing facility was established in 1997 by a Philippines investor (RD Tuna Canners). Since this time, two more plants have been established (SSTC and Frabelle).
  • Total production capacity is estimated at 100,000 mt per year), although all  plants are operating at below capacity. All three plants source fish locally from either PNG flagged or PNG-chartered vessels.
  • Duty free access to the EU market, coupled with the recent RoO relaxation under global sourcing provisions, enables PNG to compete against lower cost sites of production for exports to the EU. The domestic canned tuna market is significant, accounting for 20- 30% of production by local canners.
  • There has been significant interest from foreign investors to establish additional canned\ tuna processing facilities in PNG, with proposals in various stages of development for an additional four plants in 2010. New investment is driven largely by licensing incentives from second generation access arrangements.
  • Despite advantages conferred by duty preferences, relaxed RoO and rich tuna resources, PNG processors continue to face many challenges including low labour productivity, a high-cost operating environment and infrastructure constraints.

Solomon Islands

  • SoltTuna Fishing and Processing Ltd. (formerly Soltay & Solomon Taiyo) is currently the Solomon Islands’ sole tuna processing plant.
  • The plant operated at less than full capacity during 2009 and mostly focused on loining for the EU market (Italy). In September 2010, Tri Marine became SolTuna majority investor (51%).
  • Two proposals for new processing developments are in place. Philippines-owned Frabelle Fishing Corporation is proposing to establish a facility (50-100 mt/day) in either Guadalcanal or Western Province. Dongwon (Korea) has also proposed to establish a facility in Guadalcanal (200 mt/day), contingent on Solomon Islands Government establishing wharf facilities. But not nothing has happened so far.

Others - WCPO

  • There is one major canned tuna processing operation in Levuka, Fiji (PAFCO) which commenced operations in 1976. It has operated since 1999 as a loining plant under contract to Bumble Bee. Daily processing capacity is 120 mt/day, but could potentially be increased to 180 mt/day if sufficient cold storage becomes available.
  • A loining plant was built in Majuro, Marshall Islands in 1999. After withdrawal by the former owner and a period of inactivity for several years, the plant was purchased by a Chinese investor (Pan Pacific Foods, a subsidiary of Shanghai Deep Sea Fishing Company) in 2006. The plant commenced trial processing in 2008, but suffered technical difficulties and temporarily closed until mid-2009. Potential processing capacity is 80-100 mt/day, but to date, the plant has been operating at less than half this capacity.

Others - EPO

  • In addition to Ecuador, there are a number of other Latin-American (EPO) based canned tuna processing sites) – Mexico, Colombia, Venezuela, Costa Rica, El Salvador and Guatemala. Total production capacity of these plants is 1,710 mt/ day. After Ecuador, Mexico is the second most significant EPO-based processor. Latin American processors enjoy duty free access to the EU (loins/cans) and US (pouch) markets.

FAO expert consultation on Catch Documentation Schemes by Francisco Blaha

All of next week I’ll be back at UN FAO headquarters in Rome, a place where I lived during my time as a fishery officer for them. July is a nice time to be there, balmy nights, aperitifs and so on… not that I would have much time to be outside, tho…

regulatory sword fight venue :-)

regulatory sword fight venue :-)

FAO is conveying an expert consultation on catch certification and invited a various experts from different parts of the world to sit and discuss a series of technical guidelines that emanated from a background study.

I’m one of the 2 authors (with Alastair MacFarlane) of the study and guidelines. Our methodology was based on the review of the existing bibliography and our experience in the issue. We incorporated the work done by my friends Shelley Clarke (Best Practice Study of Fish Catch Documentation Schemes, 2010) and Gilles Hosch (Activity on Tuna CDS Best Practice, present).

A number of documentation schemes have developed over the last twenty years and others are under consideration. We reportedthe current state of play of existing schemes and a draft set of Technical Guidelines for schemes from a supply, market and cooperative perspectives and are offered for discussion.

Needles to say it is not an easy process, a lot of heavy politics and patch defending from some of the stakeholders, furthermore this type of semi-diplomatic work does not come natural to me.

I’m firstly an operational guy (fishers, boats, wharfs, industry, fishery officers work), then I like research and fact finding and lately increasingly involved in data management, but I'm definitively not a meeting room guy. It frustrate me intensely the long discussions about words here and there...  I really care about concepts and plans ahead, but that surely is a personal view out of not being engaged much in the necessary bureaucracy. 

A lot of my contributions to the study were vetoed or removed, (for example: the details on the administrative burden for the supplying states -particularly least developed countries-, nor any of the operational difficulties associated to the forms and timings around the schemes, as this was determined to be too sensitive and critical of the organizations and trade-blocks driving the schemes.

Nevertheless, I’m looking forwards to the next days, even if meeting rooms are not my element, but based on my background and experience in dealing with these certifications from a small countries perspective that need to export, I feel I can contribute to the discussions and hopefully to a catch certification system that is able to minimize the prevalence of IUU fish and at the same time does not imply a disproportionate burden to lesser developed countries. 

Once, I read that in this type of processes; if you are not sitting at the table, you become dinner ☺. So let see!

analysis of 4 suppositions in shark fisheries by Francisco Blaha

I get ask a lot about the shark fishery and its issues by my non fishery friends, who they normally assume that if I work in fisheries then I should know…  and while I’m a generalist by nature I do have my specialities and Sharks isn’t one of them.  Is a bit like saying to a Civil engineer that make bridges about dams, he may know the basics, but hardly can give much advice.

Ecuador

Ecuador

On the other side… I always say that if I you don't know something, the next best thing is to know the person that knows about it. And when it comes to shark capture and trade, Shelley Clarke is the person (she actually is one of those rare individuals that knows a lot about a lot… and sharks is one of her many topics). At the present she is the Technical Coordinator-Sharks and Bycatch, Areas Beyond National Jurisdiction Tuna Project, Western and Central Pacific Fisheries Commission

Last years she published an article in the SPC Fisheries Newsletter, where she analyses 4 commonly held suppositions, that the interested public has on shark fisheries, which I’ll quote in this post.

Am I eating shark?
Demand for this luxury product is one of the reasons why there are extensive and centuries-old trade networks linking China with far-off countries. Ironically, despite its venerated status, the Chinese refer to shark fin simply as yú chí (鱼翅, fish fin) rather than using the Chinese words for shark (shāyú, 鲨鱼). This may be the reason why some surveys report that consumers do not always know that the product is derived from sharks. 

The Chinese are not alone in failing to recognize sharks on their plates: sharks have long been used, often under other names, as the “fish” in fish and chips in Europe, Australia, New Zealand and elsewhere. Therefore, while sharks have become conspicuous as entertainment since the 1970s, they have been important as commodities for centuries.

In September 2014, the implementation of multiple new listings for sharks and rays by the Convention on International Trade in Endangered Species (CITES) of Wild Fauna and Flora (see below), underscored the need to re-kindle interest in using trade information to complement fisheries monitoring. 

These CITES listings are a spur to integrate international trade information with fishery management mechanisms in order to better regulate shark harvests and to anticipate future pressures and threats. To highlight both the importance and complexity of this integration, this article will explore four common suppositions about the relationship between shark fishing and trade and point to areas where further work is necessary.

Supposition #1: Banning finning will reduce shark mortality

Ecuador

Ecuador

Many conservation campaigns have attacked the shark fin trade on grounds of animal cruelty (live finning), unnecessary waste (discarding of shark carcasses at sea), being unsustainable (overexploitation), or a combination of these. As a result shark finning — the practice of removing a shark’s fins and discarding its carcass at sea — is banned in many fisheries. Setting aside for the moment the issue of whether all the different formulations of these bans are enforceable (e.g. the 5% fins-to – carcass ratio), it is important to note that even under perfect enforcement, finning bans may fail to reduce shark mortality. This is because finning bans do not regulate the number of sharks killed, only the way in which they are killed.

For fisheries that primarily want sharks for their fins, unless there are catch controls in place in addition to the finning controls, for example as in New Zealand’s Quota Management System, an unlimited number of sharks with valuable fins can be retained and landed, with the fins sold and the carcasses dumped. Alternatively, there may be high demand for shark meat and, therefore, no incentive to fin sharks and discard carcasses at sea. 

A recent analysis in the Pacific found that even before the finning ban, overfished oceanic whitetip and silky sharks were more likely to be retained than finned. With or without a demand for shark meat, as long as the fishery is able to accommodate the storage and transport of shark carcasses to port, a prohibition on finning sharks may make no difference to shark mortality rates. Bans on finning in the absence of catch controls also do not prevent fishermen from intentionally killing and discarding sharks; for example, to reduce bait loss on future sets.

There is growing recognition that shark management and conservation must look beyond simply regulating finning, but effective measures to control shark mortality within sustainable limits remain to be adopted and verified in most national and international waters. One benefit of an increasing demand for shark meat should be that it is easier to identify shark carcasses (as sharks, if not always to species) at transshipment, port and border inspection posts as compared to shark fins which can be dried and packed away with other cargo.

Supposition #2: Consumers are being influenced by shark conservation campaigns

Eucador

Eucador

Some shark conservation campaigns have focused their efforts on Chinese consumers in the hope that increased awareness of threats to sharks would reduce their consumption of shark fin. A report in the New York Times in mid-2013 quoting both campaigners and traders, suggested that the trade had declined as much as 70% from 2011 to 2012. While there is no question that the shark fin trade in Hong Kong and China has contracted, both the scale of the contraction and its causes are debatable.

A forthcoming study of Hong Kong shark fin trade statistics — the most accurate proxy for global trends— documents that imports have been dropping since 2003 and that the media reported declines of 70% from 2011 to 2012 reduce to ~25% when calculated using the proper adjustments for water content and commodity codes changes. China’s trade statistics for shark fin are less reliable than Hong Kong’s due to commodity coding issues, but there are also media reports of a dip in demand in the northern capital, often attributed to new rules for government hospitality expenses announced in late 2012. Additional support for the effect of these rules, which restrict purchases of “shark fin, bird’s nest and other luxury dishes”, comes from reports of declining sales of other luxury seafoods such as abalone, sea cucumber, lobster and crab.

But are shark conservation campaigns having any effect on Chinese consumers? It seems impossible to answer this question definitively, but independent interviews of 20 Beijing-based restaurateurs conducted just before the new government hospitality rules were announced offer some insight. All respondents agreed that consumption was falling, but there were divergent views on whether the conservation campaigns were the reason.

Some stated that diners were shunning shark fin dishes because they are unhealthy, passé, or, most importantly, likely to be made from artificial materials given the threatened status of sharks and the expected shortage of real fins (. Without fully understanding the scale or cause, it still seems safe to conclude that the demand for shark fin in China is waning and that sounds like good news for sharks.

Less encouraging is the finding by the new Food and Agriculture Organization (FAO) analysis that Thailand has surpassed Hong Kong as the world’s largest exporter, and its main trading partners — Japan and Malaysia — may be among the world’s top four importers, particularly of small, low value fins. Not only do these markets show no sign of slowing down, they are all among the world’s top shark fishing nations and, thus, the full scope of their shark fin markets may be even larger than trade-based estimates suggest. When we add to this the facts that most consumer-orientated conservation campaigns target shark fins rather than meat, and that shark meat consumption is both growing and often unrecognized as “shark”, it is clear that the campaigns have more work to do.

Supposition #3: The trade will collapse when shark stocks become overfished

Sri Lanka

Sri Lanka

A third thorny issue at the intersection of shark fishing and trade is the ability of shark populations to support the global fin and meat trades. While many argue that shark populations have already begun to collapse, how have the high trade volumes for fins and meat been maintained for this long?

FAO maintains the only ongoing worldwide compilation of shark, skate, ray and chimaera (chondrichthyan) catches, and if we tally their catches reported as “shark” and “unidentified sharks and rays” they are 20% lower in 2010 than they were in 2000. The amount of catch reported as “skates and rays” is 16% lower. The amount of catch reported specifically as “sharks” has increased but this could be due to greater species-specific reporting rather than a real increase in catch. A fallback to levels of ~11–23% less than the peak is also visible in the Hong Kong shark fin import data for 2004–2011. Despite the potential for the relationship between shark catch and trade to resemble the relationship between chicken and egg, it ahs been concluded that the decline in reported chondrichthyan catches is due to overfishing, not a result of decreases in fishing effort or market demand.

Given the reproductive rates of most shark species, it may be surprising that these observed declines in catch and trade statistics are not larger. One possible contributing factor is species substitution. As shown in a forthcoming analysis, the relatively productive and distinctive blue shark is becoming a larger component of reported shark catches compared to the less productive, but equally distinctive and more valuable, mako shark. Therefore, it is likely that the shark fin trade is even more dependent on blue shark than it was in 2000 when that species supported at least 17% of the market.

There are already some visible signs of overexploitation in catch and trade statistics, and these may be damped down by substitution of more productive species for those whose populations have already collapsed, for example the oceanic whitetip shark. While there are complications in the data that hamper definitive conclusions, better catch reporting must be encouraged and more focused shark catch and trade analysis is certainly warranted.

Supposition #4: Prohibiting shark catches will curtail trade and reduce pressure on shark populations

Ecuador

Ecuador

It is easy to assume that forbidding fishermen to catch sharks will lead to a suppression of the shark trade and a conservation benefit for shark populations. But here, too, the devil is in the detail: both the ability and desire of fishermen to avoid catching and killing sharks need to be strong for this supposition to hold.
In tuna and billfish fisheries, sharks are caught alongside these target species in large numbers. Methods to reduce unwanted shark catches are a topic of active research but solutions appear to vary by fishery and may have economic or operational consequences. Under two forms of catch prohibition — no-retention measures for certain species and area-specific prohibitions for all species (sometimes referred to as “sanctuaries”) — sharks, if caught, must be released with minimal harm.

However, studies in the Indian and Pacific Oceans have shown that 81–84% of sharks do not survive their encounter with purse-seine gear. In longline fisheries it is estimated that 12–59% of commonly caught shark species will die before reaching the vessel 10–30% of those that survive haulback will die through handling, and 5–19% of those that survive handling will die after release. 

Without having read the studies where this figure come from, but based on my experience as a fisherman and observer on these fleets, I’ll say they are about right… besides it is really difficult to deal with a shark once it is on deck. When I was working in the trawlers in Argentina an Angel shark (squatina) bit my foot, thankfully I had a steel cup boot, but that beast bent it in a way that trapped my foot and did not let go. We had to kill it and behead it, as to release the jaws from my boot and then I had to put my foot in a vice to saw the boot out of my foot… is stayed away from sharks since then…

In any case, with such high potential mortality rates for released sharks, it is not clear whether no-retention and “sanctuary” measures can reduce overfishing to sustainable levels. Whenever discarding sharks is seen by fishermen to come at a cost — for example loss of saleable products or increasing the likelihood that the next set will catch the same unwanted shark — enforcement must be strong.

Small Island Developing States often struggle to find the resources to conduct intensive patrols at sea. Even if catch prohibitions in “sanctuaries” are strongly enforced, vessels that want to continue to catch and retain sharks, or to kill unwanted ones, may move to other jurisdictions with fewer rules and less monitoring (such as the high seas) and continue to fish the same stocks.

Trade data can help to highlight areas where existing fisheries controls may need to be strengthened. For example, the Marshall Islands declared itself a shark “sanctuary” in 2011 by prohibiting both catch and trade. Nevertheless, Hong Kong government records show imports of 7.2 t of dried unprocessed Marshallese shark fins in 2012 and 2.5 t in 2013. Similarly, United States trade records show 16 t of frozen shark exported to Palau in 2012 and 15 t in 2013. While Palau may not have banned the trade in sharks, these exports suggest that the demand exists, either nationally or for onward trade, and this demand could undermine Palau’s designation as a shark “sanctuary” in 2009. These examples provide further impetus for integrating fishery and trade monitoring programmes.

Sri Lanka

Sri Lanka

This article has highlighted a number of ways that management of both shark catch and trade data can be integrated for conservation benefit Relating the following issues with the respective recommendations (in Italics.)

Monitoring trade data can help interpret stock status and identify future threats, but it is dangerous to focus on single products and markets (e.g. shark fins in China) because trade patterns may shift while catches remain high (e.g. increase in demand for shark meat). Fisheries management and trade measures need to focus on effective control of shark mortality, whether or not it is due to finning.

Consumers are influenced by a number of factors, only some of which relate to conservation concerns. Even consumers with preferences may not always be able to identify unlabelled shark products. Conservation campaigns focused on shark fins need to recognize the growth in the shark meat trade.

Despite overfishing, trade levels can appear stable or to be increasing due to improvements over time in species-specific catch reporting and substitution of more abundant species when less productive populations crash. Better catch and trade data are key to identifying early warnings of shark overexploitation.

Prohibiting shark catches should be complemented by improvements in bycatch reduction, adequate enforcement and development of trade surveillance programmes. Fishery and trade data should be used in conjunction to monitor compliance with regulations and overall stock status.

El Nino to move tuna to central Pacific by Francisco Blaha

The Secretariat of the Pacific Community (SPC) says a strong El Nino event this year is likely to push tuna fisheries towards the central Pacific and away from fishing grounds of Papua New Guinea, Solomon Islands and Palau.

Self explanatory&nbsp;

Self explanatory 

The SPC's Oceanic Fisheries Programme Manager, John Hampton, says this year's El Nino event is predicted to be the strongest since 1997. He says stocks will likely move towards the exclusive economic zones of Kiribati, Tuvalu, Tokelau and Nauru, as water temperatures change.

"We should see very strong fishing activity and catches over towards the central Pacific side of the region. If this event impacts the biology of the tuna resource in a similar fashion as it has in the past, we should possibly see a fairly strong recruitment particularly for Skipjack tuna next year, towards the end of next year."

John Hampton says this suggests the high catches being experienced at the moment will continue, and while that's good from a catching perspective, there is concern the current depressed price of Skipjack tuna in the marketplace will not be assisted by continuing strong supply.


First World Problems by Francisco Blaha

A break off fisheries for one post... or kind off.

A lot of my work can be dismissed as First World Problems, Fisheries Compliance and Seafood Safety seems to matter more to the developed countries that actually collapsed their own fisheries or seems to be really fussy about their food... in many of the countries I work, the budget  for the authorities in charge of these issues is bigger than the one for Denge or Malaria...

So I get that cricism a lot... but the "first world" has its own deeper problems, and they are as well very good at neglecting.

My favourite communicator of philosophy, Alain de Botton put it very nicely in the following video... they may have a lot of "stuff" but they lack the wisdom that I have seen in the elders many of the smaller islands I work.

The more interesting parts (for me) come after the 1st  minute.


Harvest Strategies? by Francisco Blaha

Fisheries management as any other field has "new" concepts that appear and propose new ways to see old and new problems. One of these is Harvest Strategies, the explanation  by the Pew Trust that I'm quoting here, is a good place to start.

Traditional fisheries management is a two-step process: First, scientists conduct stock assessments, and then fishery managers negotiate measures, such as quotas or time-area closures, to make sure that the resource-the targeted fish- is being used optimally and sustainably. While this seems simple enough, the current approach is anything but.

With imperfect knowledge about fish biology, incomplete fishery data, natural variability, and the inherent challenge in using models to count fish in a population, stock assessments are frequently fraught with uncertainty. That means the results can vary considerably from one assessment to the next. Scientists are asked to provide advice to managers based on these assessments, but given the uncertainties, the advice can be vague or include a wide range of management options.

Most tuna fishery management bodies have committed to following scientific advice and the precautionary approach, but without a clear framework for making management decisions, negotiations often become contentious, time-consuming, and expensive.

But an alternative approach, known as harvest strategies or management procedures, is emerging as the next innovation in fisheries management. Incorporating existing tools such as monitoring programs and reference points, harvest strategies bring all the pieces together and provide managers with an improved lens through which to determine the best path forward for the fish and the fishery.

What are harvest strategies?
Harvest strategies are pre-agreed upon frameworks for making fisheries management decisions, such as setting quotas. Although different forums define or describe the approach slightly differently, all include the same elements. Those components generally include a monitoring program, a stock assessment method, reference points (or other fishery indicators), and harvest control rules.

With many moving parts, the number of potential harvest strategies is limitless. Management strategy evaluation (MSE), a procedure based on a simulation tool, helps compare the likely performance of various strategies and in many ways guides the process of harvest strategy development.

The harvest strategy dictates the relationship among the four components and establishes a feedback loop. The data from the monitoring program are fed into the stock assessment method. Then, the assessment evaluates how the fishery is doing relative to established reference points.

The results of this evaluation activate the harvest control rule, which leads to modifications to the management measures to ensure that the predetermined management objectives are met. The cycle then begins again with the monitoring program recording the effects of the new measures, the stock assessment evaluating these effects, and so on.

The stock assessment method does not have to be based on the standard full and complex assessment model but can simply be one of the fishery’s catch-per-unit-effort (CPUE) series, a method for estimating the catch rate for that fishery. Likewise, management measures need not be limited to catch limits. Harvest strategies can also include limits on fishing effort or time-area closures. They just have to prove their effectiveness in the management strategy evaluation process.

Advantages of Harvest Strategies Over Traditional Management
Effective harvest strategies can:

  • Offset natural variability, scientific uncertainty, and political influence.
  • Account for risk and allow for balancing of trade-offs.
  • Avoid time-consuming and costly negotiations in response to each stock status update.
  • Allow managers to act swiftly and efficiently to ensure the health of the resource and longterm profitability.
  • Increase market stability and improve industry’s ability to plan because management decisions are predictable.
  • Give all stakeholders a clear, long-term vision of a sustainable stock and fishery.
  • Adhere to best practices of modern fisheries management, consistent with the United Nations Fish Stocks Agreement, the Food and Agricultural Organization Code of Conduct for Responsible Fisheries, and the Marine Stewardship Council’s certification standards.
  • Effectively implement the precautionary approach.

Components of harvest strategies

Management objectives
The stock assessment method does not have to be based on the standard full and complex assessment model Managers of tuna fisheries commonly approach their work with the general objective of maintaining the population at or above the level that can produce maximum sustainable (BMSY). In the context of harvest strategy development, however, management objectives take a slightly different form.

While still setting goals for the fishery, management objectives are more specific and measurable, and often there are more than one. For example, a single stock could be managed with multiple objectives to maximize catch, stability in year-to-year catch limits, profit, the speed of stock rebuilding, and the likelihood that the population is above BMSY (the biomass that will produce maximum sustainable yield) and fished below FMSY (i.e., in the green quadrant of the Kobe plot, a graphical representation of the status of a stock and fishery). In cases in which some objectives are deemed more important than others, managers could choose to weight them. For example, rebuilding the stock in a timely fashion might be the priority, even if that requires a lower catch in the short-term.

The stock assessment method does not have to be based on the standard full and complex assessment model Setting the management objectives is the critical first step in the development of a harvest strategy because all subsequent steps focus on achieving those objectives.

Reference points
Reference points are benchmarks used to compare the current status of a fishery management system to a desirable (or undesirable) state. When matched to the management objectives for a fishery, they can be used to assess progress toward meeting those objectives. There are two main types of reference points—limit reference points (LRPs, or Blim and Flim) and target reference points (TRPs, or BTARGET and FTARGET)—which are often based on fishing mortality rate (for example, FX%) or population abundance, such as BMSY.

Limit reference points define the danger zone, the point beyond which fishing is no longer sustainable. This zone should be avoided, but if it is inadvertently violated, immediate action should be taken to return the stock or fishing rate to the target level. Stock rebuilding programs should consider the LRPs the very minimum rebuilding target. Importantly, the LRPs should be based exclusively on the biology of the stock and its resilience to fishing pressure. Economic factors should not be considered.

Target reference points define the ideal fishery state, and management should be designed to keep the resource close to this state with high probability. Given all of the unknowns and uncertainty in stock assessments, as well as fisheries management in general, the TRP creates a buffer zone to ensure that the limit is not breached. The fishery is likely to fluctuate around the target but should not exceed that level on average. Unlike setting a limit reference point, the TRPs can be based on biology as well as ecological, social, and economic considerations.

Importantly, both target and limit reference points should be set more conservatively as uncertainty increases. If there is high uncertainty and/or a less comprehensive monitoring program, the TRP should also be set further from the LRP to create a bigger buffer and guard against violation of the limit.

What Is Uncertainty?
Fisheries science by its nature has varying levels of uncertainty. Managers aim to minimize this uncertainty where possible and to understand the potential impact of the amount that remains. Management systems then can be designed to protect against those effects.

Not all uncertainty is created equal. Fishery scientists typically consider four types:

  • Model. A set of equations cannot perfectly explain a wild fish population. Which stock assessment model should be used? How should the model be structured?
  • Observation. Even the measurable data used in a model are likely to have biases, causing sampling error. Are the catch data accurate? How has technology affected catchability, which is essentially a stock’s susceptibility to fishing?
  • Process. Unknowns about the biology and population dynamics of the most studied fish stocks can have significant impacts on estimates of current and future stock status. When do the fish mature? Is the number of young born each year related to the number of adults in the population?
  • Implementation. Although precautionary regulations may be in place, compliance and enforcement can be an issue. What is the difference between the catch limit and actual catch?

Greater uncertainty means greater risk of failure to meet the intended management goals. This in turn necessitates greater precaution in management decisions.

Harvest control rules
Also known as decision rules, harvest control rules (HCRs) are a pre-agreed upon set of management responses to various triggers, such as a change in the stock status or economic or environmental conditions. These triggers may or may not be related to the reference points themselves.

For example, target reference points are often set as the first trigger. By prescribing an automatic management response when the TRP is breached, the HCRs help to ensure that limit reference points are not violated. But in cases in which the harvest strategy’s assessment is simply a CPUE series, the trigger for the HCR may be a threshold value of the CPUE index itself, rather than a reference point. In addition, economic or other indicators may serve as triggers instead of, or in addition to, biological reference points.

Harvest control rules are selected and adopted by managers, but the decisions are based on strong scientific support and stakeholder input. Because these rules provide a clear framework for managing the fishery going forward, they increase the predictability and transparency of the management process. They also streamline the process to make it more efficient and more effective.

Management strategy evaluation
Management strategy evaluation is a process that uses a simulation tool to determine the “best” performing harvest strategy. The MSE assesses the uncertainties in the system to examine how likely the candidate harvest strategies are to achieve the chosen management objectives. In other words, it tests various possible frameworks to see what happens. In so doing, it can reveal the trade-offs among different decisions, often leading to a closer inspection of the weight given to the various management objectives and helping managers determine whether other weights may be more appropriate. The MSE is an essential part of the process of developing and agreeing to a harvest strategy.

The MSE uses a tool, or operating model, to simulate the entire fishery, factoring in management decisions, the implementation of those decisions, the monitoring program, and the impact of the fishery on the area’s ecosystem. Unlike current management approaches, the MSE also accounts for uncertainty by incorporating the full range of current hypotheses about the fish and fishery and weighting them according to which are deemed, through scientific analysis, to be more likely.

The MSE determines which of the uncertainties have the biggest influence on the results. The management strategy evaluation is therefore also a useful tool for setting research priorities because it identifies which knowledge gaps pose the greatest problems for management. Still, the primary function of the MSE process is to compare the likely ability of the candidate harvest strategies to fulfill the pre-agreed upon management objectives in a wide range of simulated scenarios. The comparison is based on simple performance indicators, for example, by looking at the number of years in the simulation that the resource has been below a specific reference point.

Undertaking an MSE requires a team of scientists, managers, and stakeholders. While the scientists do the modeling, managers must offer extensive input. For example, managers must determine management objectives and acceptable levels of risk. The acceptable risk quantifies the likelihood of a negative outcome in a fishery, such as breaching the LRP. It should be chosen based on a cost-benefit analysis and should be lower in cases of greater uncertainty.
Because of the many steps and the iterative process, communication among parties is critical for achieving buy-in on the results of the management strategy evaluation.

Conclusion
If designed correctly, harvest strategies benefit both the fish and fishermen. Recognizing the effectiveness of these tools, all international tuna management bodies are developing or implementing strategies appropriate for their fisheries. Each group can build on and complement the work of the others and benefit from the collective lessons learned along the way.

While undertaking an MSE to select a final harvest strategy requires significant time and effort, the evidence suggests that the initial investments quickly reward the stakeholders in those fisheries where these strategies are already being used. A precautionary harvest strategy, paired with an effective compliance regime, can ensure full recovery of depleted stocks and provide long-term, sustainable, and profitable fisheries.

Fishing for a Sustainable Future in the Pacific Islands (video) by Francisco Blaha

The World Bank in Sydney has just published a video of a small seminar where a panel discusses the importance of fisheries to Pacific Island nations. They don't go to deep into many topics, but is quite interesting talk on many of the areas I work on daily basis.

Panelists include Transform Aqorau, CEO of the Parties of the Nauru Agreement Office (PNAO), he is a friend... a very well read and clever man, I always listen a lot to what he has say, we share a love of reading, the believe on "thinking outside the box" and the believe that Fisheries Information Management Systems are the way to control the fishery.

The next panelist is Kate Barclay, Associate professor, University of Technology Sydney who I also meet before, she has done work for Greenpeace and other NGOs on Pole& Line.

The 3rd one is John Virdin, Director, Ocean & Coastal Policy; Nicholas Institute for Environmental Policy Solutions at Duke University, whom I have not meet before.

Is a good discussion.


The effects of harvest regimes on ecosystem structure and function. by Francisco Blaha

Back in the late 80s when I worked as an observer in the commercial fleet and then a science technician in fisheries research vessels, I did a lot of sampling. The usual job was measuring, sexing and extracting the otholites for later analysis, but then one of the subsamples was what we called “Trophic Ecology” (The study of the feeding relationships of organisms in communities and ecosystems - from the greek τροφὸς: to nurse/feed). The whole idea of this type of work is to understand who eats who in the ecosystem, and how a potential change in abundance at any trophic level could impact the rest.

So after butchering the fish to sex it and removing the otolithes from the cranium, we will get right into the guts, and analyse the stomach content for identification and weight of what ever was recognisable… (we got trained into identifying non digested features). 

Not the most charming job in fisheries biology, and particularly with bad weather. But the results where quite critical for the wider job and understanding of the “whole picture”.

So I was immediately drawn to a report published by SPC a few weeks ago based on results of  of around 12000 stomach analysed over the last decade.  I'll transcribe below some of its methodologies and conclusions.

Building the warm pool ecosystem model

SPC analysed  the over 12,000 predator stomachs  collected and analysed since the monitoring began. Results of these analyses have been incorporated into a trophic model that describes the warm pool ecosystem and allows forecasting the dynamic responses of the ecosystem to simulated changes in fishing effort through time (Ecopath with Ecosim).

Simplified view of the generalised food web supporting tuna and other large pelagic fish in the warm pool. Note that,&nbsp;at the bottom of the food web, both phytoplankton (microscopic plants) and ‘marine snow’ (phytoplankton and&nbsp;zooplankton r…

Simplified view of the generalised food web supporting tuna and other large pelagic fish in the warm pool. Note that, at the bottom of the food web, both phytoplankton (microscopic plants) and ‘marine snow’ (phytoplankton and zooplankton remains decomposed by bacteria, also known as detritus) contribute trophic inputs.

The modelled simplified ecosystem was composed of 44 groups: fisheries discards (1 group), detritus (1), phytoplankton (2), zooplankton (2), forage/prey groups (epipelagic, mesopelagic, bathypelagic, migrating or not, fish, mollusc, crustaceans) (11), bycatch species (rainbow runner, pomfret, opah, lancetfish, escolar and oilfish, small tunas, dolphinfish, wahoo) (8), tuna (albacore, skipjack, yellowfin, bigeye of different size classes) (8), sharks (oceanic white-tip, silky, blue, mako and other sharks) (5), billfish (swordfish of two size classes, striped marlin, blue marlin and other billfishes) (5) and turtle (1).

Four fisheries (longline, pole-and-line, purse-seine unassociated schools, purse seine associated schools) were included in the model.

Nine scenarios of fishing effort were explored. They comprised measures designed to reduce/increase the catch of the bycatch community and measures designed to reduce/increase the harvest of tuna by (a) altering the amount of longline fishing and purse-seine fishing, both unassociated (free schools) and associated with fish aggregating devices (FADs), and (b) by simulating the implementation of bycatch mitigation measures. Results were projected for 2026 and 2046.

How does the warm pool ecosystem work and what are its key dynamics?

The warm pool ecosystem model is characterised by a large number of trophic links between&nbsp;groups and a diverse pool of prey on which a wide diversity of predators is feeding.

The warm pool ecosystem model is characterised by a large number of trophic links between groups and a diverse pool of prey on which a wide diversity of predators is feeding.

The majority (74%) of the ecosystem’s biomass is in phytoplankton and zooplankton (trophic levels TL 1 and 2), whereas the industrial fish catch (tuna and bycatch) are in TL 4 and 5 at the top of the food web, representing less than 8% of the total biomass of the pelagic ecosystem.

The most important keystone group in the warm pool ecosystem model is small yellowfin tuna, due to its high production and consumption values and its diverse diet. The next most important keystone groups are the prey organisms, which have high production values as predators, but are also important prey for a range of larger fish such as tuna and marlin.

Potential impacts of fishing strategies on the whole ecosystem

The modelled ecosystem was resistant to considerable disturbance from fishing. They suggest that this is related to the considerable diversity of predators in the food web that consume a wide range of prey. Maintaining the diversity contributes importantly to the sustainability of the system.

The structure of the ecosystem was most sensitive to changes in the biomass of prey groups (e.g. small pelagic fish, such as anchovy) because these mid-trophic level species are important prey for tuna, as well as being predators for lower trophic levels, such as zooplankton. Hence, variations in prey availability and quality in relation to changes in the climatic conditions will affect the whole ecosystem and the fisheries.

The simulations showed that groups comprising longlived, bycatch species with low productivity, such as sharks, opah and billfish, are most likely to be affected by changes in purse-seine and longline fishing effort.

Increases in purse-seine fishing on FADs results in greater mortality of sharks and decreases in the biomass of some species and size classes of tuna. This scenario had the most negative impact on the ecosystem. Conversely, reductions in purse-seine fishing on FADs increases the numbers of sharks, although such benefits are not as pronounced when purse-seine fishing effort on FADs is transferred to purse-seine fishing on free schools of tuna.

Increases in longline fishing result in greater mortality of sharks, opah and some billfish species. The negative impact on opah and billfish is also observed when longline fishing effort is unchanged but shark mortality is decreased by the implementation of shark mitigation measures. The simulations to date suggest that some species of the ecosystem will benefit from variations in fishing effort and others will lose; managers will have to define which groups of species are expected to benefit.

It is also apparent that no single indicator is able to provide a good representation of the responses of the ecosystem to changes in harvest. This reflects the complexity of the ecosystem. The use of a variety of indicators is likely to be required to detect the full range of impacts from alterations to harvest strategies.

As with tuna stock assessment models, use of the best available data is critical. Continued and expanded monitoring of catch and discards for bycatch species by observers (at sea or electronic) is critical for further model development and improvement. Similarly, expanding fisheries monitoring programmes to include prey species through predator stomach collection as a routine observer duty is necessary to spatially disaggregate the model.

Further reading
Allain V., Griffiths S., Bell J. and Nicol S. 2015. Monitoring the pelagic ecosystem effects of different levels of fishing effort on the western Pacific Ocean warm pool. Issue-specific national report. Oceanic Fisheries Programme, Secretariat of the Pacific Community, Nouméa, New Caledonia.
http://www.spc.int/oceanfish/en/publications/doc_details/1376-monitoring-the-pelagic-ecosystem-effects-final 

PNA to implement FAD initiative by Francisco Blaha

The Parties to Nauru Agreement (PNA)  passed an initiative to trial a charge of US$1,000 on each Fish Aggregating Device (FAD) set in PNA waters.

Not for free anymore

Not for free anymore

In what was dubbed the "free school initiative," Ministers at the annual PNA ministerial meeting in Federated States of Micronesia's capital Palikir, decided that a US$1,000 fee paid on top of the Vessel Day Scheme fee would be good incentive "not to set FADs" on free schools of fish.

From January 2016 next year PNA member nations across the board will try out the new initiative to levy a fee of $1000 on each ship that sets FADs in a fishing day.

The decision in Pohnpei follows a PNA Ministerial endorsement to look into the possibility of such an initiative on FADs when they met in Tuvalu last year; something the host nation and Tokelau were particularly keen on. These are two of the smallest and most vulnerable members of the PNA and fishing in their waters is very dependant on the use of FADs.

Currently FADs are managed in the region at a WCPFC level with a four month closure of FAD fishing which is aimed at primarily reducing juvenile Bigeye, juvenile Yellowfin and other bycatches that are taken during FAD use.

Dr Aqorau said for Tokelau and Tuvalu and some other PNA members this is a crippling burden on them in terms of reduced revenue because it makes fishing in their waters much less attractive to the boats on which they depend for their revenue.

These two countries like other PNA members remain committed to Bigeye conservation but looking for a way to reduce FAD use that is less a burden on them.

The "free school incentive" would provide a positive incentive for vessels to fish on free schools while leaving them free to manage their operations in a way that would be most profitable for them.

At the same time it will still be aimed at reducing FAD use at a lower cost to the industry and therefore with less impact on PNA member countries especially those where fishing is more dependant on FADs

The ministerial decision means fishing vessels will pay US$1,000 per day for any fishing day in which sets are made on FADs.

The PNA member nations will first start the trial in 2016 to see the best way to implement it and then return to report their findings to the PNA ministerial meeting.

This week’s annual policy meeting will provide the venue for PNA ministers to continue to strengthen control and management of the PNA fishery, which accounts for 70-80% of the western and central Pacific tuna catch, and 30-40%of the global raw material for canning.

8 June - World Oceans Day by Francisco Blaha

World Oceans Day has been unofficially celebrated every 8 June since its original proposal in 1992 by Canada at the Earth Summit in Rio de Janeiro, Brazil. It was officially recognized by the United Nations in 2008.

I find the concept of "days" it a bit "cliche"... but then, they raise awareness (even if it is for only one day). The same "cliche" can be said perhaps about how I describe my relationship to the ocean. For me is a personal relationship, I somehow give the ocean a personality and a character... I go everyday I can into it, perhaps to say: thank you for feeding me, entertaining me and keeping me alive since I'm 17. Sorry for the abuse you get from some of me peers... I'm trying to change that... You have all my respect... or something like that. I know... a bit hippie or illogical... but I never claimed to above that. I see the ocean as a good friend.

So perhaps the best way I can honor that today is with this little piece from the SPC's (Secretariat of the Pacific Community - one of my favourite institutions in the world) latest newsletter, as it shows that big advances start with "humanly measured" steps. No change will come from things the base stakeholders do not understand, I like to think  that my job is to flatten the gap in between science and rules with people who is closer to the resource those rules and science are trying to regulate and understand.

Happy Word Oceans Day everyone!

Using body language to measure your fish

Marine animals – clams, crabs, fish, sea cucumbers, shrimps and turtles – all have to reach a certain size, different for each species, before they can spawn. It is important to leave them in the sea until they have reached that size and have therefore spawned at least once before catching them. Otherwise, there will be fewer parents for the next generation and eventually no more will be left. We also know that in fish species that grow to a large size, such as some groupers, parrotfish and trevallies, the biggest fish are the main producers of eggs and so they, too, should be protected. 

Fisheries officers put up notices and posters showing the minimum and maximum sizes for capture in markets and other public places. But these are often a long way from the fisher on the beach or in a boat, and by the time the catch reaches the market – if it goes to the market at all – the animals, other than turtles, are probably all dead. 

Most fishers across the Pacific sell their catch at a market or take it home and, with populations getting bigger, it is ever more important to follow the rules on the size of capture to avoid depleting the fisheries. Stiff penalties are sometimes handed out to those who break the rules.

The problem is, how to remember all those smallest and largest sizes and apply them when you are far from the market? Here are some suggestions, with diagrams to illustrate them.

GLOBAL SEAFOOD COMPANIES AS ‘KEYSTONE ACTORS’ IN THE SEAFOOD INDUSTRY "ECOSYSTEM" by Francisco Blaha

I knew about the Stockholm Resilience Institute, because a friend from FAO went working there, and they always seemed to me as a organization with “fresh” thinking. A recent paper they produced just reinforces that concept. I don’t know any of the authors, but hopefully they don’t mind I quote them and present their interesting publication.

They start with the ecology concept of “keystone species”, that are those …that have a profound and disproportionate effect on communities and ecosystems and determine their structure and function to a much larger degree than what would be expected from their abundance… And they adapt this concept to identify “seafood companies” that take a similar role in the global seafood industry “ecosystem”.

They recognise that globalization of seafood trade has led to industry consolidation, with large and vertically integrated transnational corporations operating across entire supply chains from production through to retail. These transnational seafood corporations play an important role in linking distant species and ecosystems to major markets and consumers. At the same time their activities may influence important species and the dynamics and resilience of the ecosystems on which their seafood harvesting and production ultimately depend.

Furthermore, the authors realize that the role of global actors like transnational corporations has received limited attention in studies of ecosystem management and in particular marine ecosystem management. Existing analyses of global fisheries operations have focused on the role of individual major countries, rather than transnational corporations.

Therefore, in their paper, they analyze whether or not a keystone pattern can be observed in the relationship between transnational corporations and marine ecosystems globally, from a combined ecological, economic and policy perspective. If such actors operate analogous to keystone species, they would not only have a disproportionate ability to steer the direction of the seafood industry but also to shape the world’s marine ecosystems and how they are managed. 

To do that this, they go trough and extensive bibliography and communicate with a very broad amount of people (many of them i do know) as to estimate the role of these largest companies in global fisheries catches, and they investigated their activities in relation to the largest and economically most important wild-capture stocks, representing whitefish, tuna, and small pelagic species. And then they a similar exercise with aquaculture species. 

Furthermore (and I find this really insightful), they studied participation in globally relevant institutions as a proxy for the potential of the companies to influence fisheries and aquaculture policy and management. They quantified the number of occasions that a company was registered as a participant during the meetings of the thirteen Regional Fisheries Management Organizations (RFMOs), using the most recent meeting documents from the main governing body of these RFMOs, including five tuna RFMOs. They also reviewed company-specific membership in global industry organisations present in several of these RFMOs, and  the role of the investigated companies in establishing, or the extent they were members in three international organizations identified as important industry initiatives for aquaculture management and certification (ecolabels).

Their results are quite staggering… They identify 13 companies (representing only 0.5% of 2250 registered fishing and aquaculture companies worldwide) that have a combined annual revenues corresponding to 18% of the global value of seafood production in 2012 (US$ 252 billion)

They represent 11–16% of the total global marine catch, and control an estimated 19–40% of several of the world’s largest or most valuable capture fisheries, including three of the most important wild-caught stocks used for human consumption: Alaska pollock (the largest whitefish stock), skipjack and yellowfin tuna (the largest tuna stocks used for the canned tuna and sashimi markets).  

They produce 10% and 14% of global fishmeal and fish oil volumes respectively and 22% of global aqua feeds (including 68% of the salmon feeds and 35% of the shrimp feeds).

These “keystone companies” are:

These transnational corporations are catching, farming and handling more than 208 species from 974 subsidiaries and associates operating in 102 countries and territories (see in the figure below). They are each highly connected and act as key nodes in the global seafood production system.

Global networks of operations. Heat map illustrating the number of keystone actors operating in each country and the respective number of&nbsp;countries in which each company operates (blue circles) as well as the total number of subsidiaries of tha…

Global networks of operations. Heat map illustrating the number of keystone actors operating in each country and the respective number of countries in which each company operates (blue circles) as well as the total number of subsidiaries of that company (purple circles). Company headquarters locations are indicated by the corresponding numbers on the map.

Their hold on the key seafood commodities is as well very well illustrated in this paper.

Regional fisheries of global relevance. Globally important wild fish stocks by volumes (grey circles with blue wedges), aquaculture production&nbsp;volumes (orange wedges), and global fishmeal, fish oil and aqua feeds (salmon, shrimp and whitefish f…

Regional fisheries of global relevance. Globally important wild fish stocks by volumes (grey circles with blue wedges), aquaculture production volumes (orange wedges), and global fishmeal, fish oil and aqua feeds (salmon, shrimp and whitefish feeds combined) volumes (purple wedges), and their corresponding economic value (green circles). The proportion of each stock controlled by the keystone actors is indicated by the size of the wedge. The number of companies active in each stock is shown within brackets.

They investigated as well, to what extent the globally connected actors participated in policy processes and found that three of the investigated companies were among the few (10%, n = 145) that were identified as active in more than one RFMO. They were active either as observers or as members of national delegations. The Korean company (Donwong) was the most active company overall, participating in six RFMOs. In addition to direct representation by the parent company and its subsidiaries, keystone actors are also indirectly participating in RFMOs through influential industry organisations. These companies also work directly with governments in a number of countries including small-island developing states in the Western Central Pacific, to secure access to the tuna resource.

The identification of keystone companies can have substantial implications for fisheries and aquaculture policy and management, as they play a central role in relation to global fisheries catch volumes and dominate several of the world’s largest wild capture fisheries.

The major wild caught species harvested by these companies are not only globally important resources for the seafood industry and consumers, but these species all individually play important roles in marine ecosystems (e.g. operating as predators or prey) and contribute to the structure, function and resilience of their respective ecosystems. Fishing for such species can have both direct and indirect effects on associated species and ecosystems, and as well impacts the production capacity of  predatory fish in aquaculture is directly connected to marine ecosystems through the inclusion of wild fish in feeds (primarily small pelagic species). Salmon and shrimp are major consumers of aqua feeds (18% and 20% of global production volumes respectively. 

Not only do these companies have the ability to shape ecosystems—they also actively participate in policy-making. The ability of non-state actors, such as transnational corporations, to influence policies can be directly correlated to their degree of participation in global (and local) governance.

Globally networked and vertically integrated companies, with an ability to influence policymaking, are resilient to disturbances that critically affect the survival of smaller companies, including financial system crises and instability, currency fluctuations, increasing fuel prices or changing fish stock dynamics.

The global connectivity of keystone actors provides them with a unique overview that enables them to know how, when, where, and with which company to strategically prioritize harvesting and sourcing activities. As keystone actors are critically dependent on a continuous supply of marine products, such global scanning ability ensures efficiency of production and consistency in resource supply. Keystone actors have historically increased their connectivity, analogous to the “rich-get richer” dynamics in other real world networks, through strategic mergers with major market or quota holders or via direct acquisitions.

As an example, Pescanova, the 7th largest company in 2012, went bankrupt in 2013, but was, due to the resilience resulting from its global connectivity and diversification of activities (active in wild capture fisheries worldwide as well as in aquaculture), able to maintain its operations and trading activities despite the bankruptcy.

What I find really “fresh” about this research is not the “naming” exersice… but the fact that we have always focus on nation states (either Flag, Coastal, Ports) as the key players which traditionally formed the basis for governance of fisheries resources and the majority of existing institutions are designed around this assumed reality, as are global fisheries statistics. 

This study reframes the responsibility for fishing in terms of transnational corporations, illustrating that 13 companies handled around 10 million tons of wild capture fish in 2012, whereas only 23 countries caught >1 million tons of wild fish that year. Several fishing companies are thus larger than most nations and at the same time take part in decision- making bodies for these resources.

Perhaps we should think how twitch a bit the governance models, and have NGOs focussing their pressure to engage them in sustainability on a concerted campaign with governments, consumers, employees, competitors, investors or financial institutions.

Again, click the link for the the original paper: Transnational Corporations as ‘Keystone Actors’ in Marine Ecosystems if interested.


Data, MCS and Catch Certification Schemes in the Pacific by Francisco Blaha

I had a very “brainy” 10 days of work so far, that challenged my big picture thinking about the integration of Catch Certification, Fisheries Information Management Systems, Monitoring, Control and Surveillance, Port State Measures, and administrative burden.

The week started with a trip to Eureka, an aptly named area in the hills inland from Byron Bay in the north of NSW (Australia) at the farm that host the development and training “centre” (a.k.a. pukpuk haus) of the Integrated Fisheries Information Management System (iFIMS) crew. 

We have known each other for a while now, I remember the fist time I presented my “fish accountancy” vision, they got it instantly and their database was able to provide the results… so we been collaboration since then, but I have not been to the “iFIMS central” as yet.

It was great… as I got to understand some of the architecture of the system, besides contributing some “fish and regulatory" insides to their really incredible set up. Moreover, what was more interesting for me, was to get to know some of them at a “human” level and confirm that what I expected; they are “believers” in the data as transparency conduit. Is more than just a job that pays the bills for them.

Data does not lie…. And the tool they have developed is the best tool I know (and is my job to know!) that can guarantee transparency around fisheries. However (as any tool), it only helps the people that handles them… it does not replace them.

From there, we flew to Nadi in Fiji for the Pacific Islands Fisheries Forum Agency (FFA) Catch Certification Schemes (CCS) Workshop, following up on a initial talk we had in PNG some months ago. It was a full house with all of the FFA and PNA member countries. 

Figure by Gilles

Figure by Gilles

The idea is to move ahead with pacific wide CDS, hopefully under the umbrella of the WCPFC. We had the presence of my friend and colleague Gilles Hosch from the FAO/ABNJ programme that put his “vision” based on his year long work analysing all the present CCS and CDS (Catch Documentation Schemes) that exist.

The view of almost all of the present schemes is the one of a Fishery led scheme (from the fishery to the market), they represent a shared concern among fishing States (both flag and coastal) port States and market States to identify legal and authorised fish and provide market access only for such fish.


In a nutshell Gilles key views are:

  • A CDS is a global traceability system
  • A competent authority certifies a batch of legal catch by issuing a catch certificate (CC)
  • The CDS traces the movement of this certified batch from unloading, through processing and trade, into the end market
  • In essence, lots are traced by linking catch certificates to resulting trade certificate(s)
  • CDS detects “non-originating” fish inside the system and nullifies its value

The ideal CDS work on mass balances for the fish that is traded in between countries. Each country in the chain takes care of what happens inside its borders, if the mass balance does not add up (more fish out than in), then the export is not authorised. The overall view for this system is as below:

Gilles masterplan

Gilles masterplan

When I understood his “macro” view, I found that my work around the Fish Unloading Authorization Code and the “Fish Accountability” inside a country (which is actually possible by using a tool like the prior mentioned iFIMS), fitted nicely inside each the countries “black boxes”, as you see below:

If it only was soo easy :-)

If it only was soo easy :-)

The 1st step is to prove that the fish was caught legally, and my concept is based in the simple fact that “Fish does not become IUU during processing, but is either caught or landed illegally”, so it “mixes” two basic elements, the requirements of Port State Measures Agreement (PSMA) and a Key Data Element (KDE) needed to follow a landing through the value chain.

No doubt all these CCS/CDS discussions where catalysed by the EU’s IUU regulation. And perhaps this is a good occasion to make my views clear in this regard: 6 years ago the concept of IUU was only known to people working on it, today the IUU issue is at the forefront of the public attention, all this is no small measure a result of the EU IUU regulation. 

My reservations and criticism has always been directed to the Catch Certification Scheme itself, and not to the aims of the regulation.

My views are about the practicalities arising from its design and the later implementation of the “weight in notes” in August 2010, making it a export certificate raised by the exporters instead of a catch certificate raised by the vessels (as it was originally intended).

The EU system is a market based system as you see on the left. It looks “backwards” to the vessel from the exporters to the authorities based 3 countries away in the value chain, for operations that happened months or years ago.

A big part of my work is to facilitate the understanding and implementation of the EU CCS system to non EU countries countries, so I know the complexities of the CCS from their perspectives. Therefore my views are always intended to make it more sustainable in the long term by twinning on its implementation (hence facilitating adoption) without diluting its objectives. 

As an example, I’m in a Pacific Island Country since yesterday, evaluating the implementation of the procedures they have generated to validate their Catch Certs for the EU, while we work on the implementation of a e-system under iFIMS that is being designed. I just went over a CC for product exported this week out of transhipments in port and landings done in February 2014. The paper trail is 38 pages long for 50 tons of product... dealing with this has a massive impact in terms of the administrative burden it puts on the fishery administration of this developing country, specially because is not web-based. 

We know that the EU is not going to change the implementation of system at all over the next years, so what we trying to do is to create our own internal system as to be able to limit the paper and time involvement by "coding" all the events from the catch onwards and have a “forwards” looking system. And when the product is going to the EU, we can trace back electronically all the events and “fish accountancy” as to print the paper certificate they request, until the day a e-system is in place (as the EU has on the sanitary side under TRACES) so then the e-certs can be “pushed” into their system.

The Pacific has been talking about a WCPFC CDS for a few years now, but complexities on the understanding, the fear of disproportionate burden, the interference of some DWFN, plus the costs associated to the development of an electronic system had made advances very slow. 

But all that is changing, thanks to the advances provided by iFIMS and the stewardship of some island countries that actually own the fish that the markets need.

What the space!