What I Learned from Tuna Diplomacy - Part 2 by Francisco Blaha

Continuing with my take on Tuna Diplomacy - Part 1, here is Part 2 focusing on what the alternatives are now that the Communism vs. Capitalism dichotomy isn’t so valid anymore and the geopolitical leverage is more complex.

The significance of the Soviet presence in 1985 was too great for the US to overlook and for the Pacific to forget. This ‘Pacific Tuna Leverage’ enabled them to negotiate effectively with larger powers. However, with the collapse of the USSR, this leverage diminished. Nevertheless, post-Cold War geopolitics presented new opportunities.

The West has long viewed the South Pacific as either “an American lake” or a traditional sphere of influence for Australia and, to a lesser extent, New Zealand. However, this perspective neglects China's long-established presence in the region, which goes through different stages due to China’s own political issues that can be traced back many centuries. 

For an in-depth analysis of the history of this presence and where China was already going, I recommend reading the late USP Professor Ron Crocombe’s 2007 masterful “Asia in the Pacific Islands: Replacing the West”

At that time, he asserted that a ‘spectacular transition’ was underway in the Pacific Islands: from ‘overwhelmingly’ Western sources of external influence, ‘whether cultural, economic, political or otherwise’, to Asian sources. While acknowledging some concerns regarding mutual misunderstanding and the discrepancies in size between Asian giants and their Pacific Island neighbours, Crocombe was less apprehensive about the growing Asian presence than many academic and government commentators from Australia, New Zealand, and the USA. Instead, he viewed this development as potentially beneficial to Pacific Islanders, as they remain adaptable and responsive to new circumstances, players, and opportunities.

However, what I have seen since 1991 is that the Chinese presence has followed a pattern, evolving from the initial presence and influence of Chinese nationals to the increasing presence and impact of the Chinese government.

The presence of Chinese nationals in the Pacific Islands can be traced back to the late 1800s and occurs in various stages[1]: Huashang, or traders seeking commercial opportunities, emerged later in the 19th century, followed by huagong, or overseas labourers, who primarily worked for non-Chinese companies. Then, in the early 20th century, the huaqiao, or sojourners, established communities that often-included huashang and huagong, maintaining ongoing connections to China. The fourth and final category, huayi, emerged after 1980, consisting of Chinese individuals who move freely within the global economy to capitalise on new opportunities and have, to some extent, transformed into a non-diplomatic corps representing the Chinese presence.

The Huayi became prominent in the Pacific Islands in the 1990s. Many members of long-standing Chinese communities in the Islands express concern about the Huayi's lack of sensitivity to local customs and view them as disruptive competitors rather than potential business and marriage partners. The Huayiare are distinguished from previous migrants by their weaker ties to China and their high degree of mobility in the global economy that has developed over the last four decades.

While the businesses of more established Chinese nationals were perceived as advantageous to locals, those of huayi frequently involved get-rich-quick schemes, such as logging, sea cucumber harvesting, coastal fisheries, shops, and supermarkets. These ventures were regarded as exploitative to locals; nonetheless, it was also in their business interests to garner support and favour from local politicians. Significant reactions can be seen in some of these contexts, such as the riots in Honiara in 2006 and 2021 and in Nuku’alofa in 2006.

In this process, it is essential to acknowledge the "cold war" between Taiwan and China, which provided the backdrop for Taiwan’s efforts to secure exclusive recognition from Pacific Island nations. However, as China has become increasingly integral to the global economy, the number of states recognising Taiwan has dwindled following a few decades of “dollar diplomacy". This involved buying recognition through aid and infrastructure less patronisingly than Western and other Asian donors, mainly by not interfering in internal affairs and refusing to comment on domestic policy in the Pacific Islands.

Somewhat paradoxically, Taiwanese and Chinese non-interference and straightforward business approaches support the free-market principles that underpin much of Western donors' aid conditionality. These donors aim to reduce government spending and replace it with private-sector providers.

Nonetheless, Chinese infrastructure projects, for instance, have faced criticism for their inadequate construction standards, an overreliance on Chinese crews instead of employing local workers, poor working conditions for local staff, and a tendency to collaborate with national governments.

With significantly greater resources, China’s diplomatic influence is expanding and concentrating on strategically important countries and sectors. It consistently supports regional political leaders with proposals that align with local political priorities, providing them access to development finance, diplomatic engagement, and crucial infrastructure such as ports, airports, and telecommunications.

In relation to “Tuna Diplomacy,” Taiwan has been the “little giant” that has excelled in the tuna industry until very recently. Taiwan began to develop its fishing industry in the 1950s, and by the 1960s, it turned to distant-water fishing to address overfished coastal waters. This transition transformed Taiwan into a global player in high-seas fisheries, particularly with tuna, and even more so in the Pacific.

Despite having one of the largest fishing industries in the world, Taiwan cannot fully engage in international fisheries management and conservation efforts due to its ambiguous political status and limited “international space.” However, it has utilised its “tuna diplomacy” as political leverage to enhance its participation in bilateral, regional, and international fisheries-related agreements.

Taiwan's official diplomatic relations have been limited for decades, and the "One China" policy hampers its participation in international institutions. China replaced Taiwan in the UN in 1971, and its growing global influence has further restricted Taiwan's ability to engage with the UN and its specialised agencies, including the Food and Agriculture Organization, the International Maritime Organization, and the International Labour Organization—all of which address fisheries issues.

Yet, the UNFSA (United Nations Fish Stocks Agreement) crystallised the concept of “fishing entities” for the first time in a binding UN instrument. Although the agreement's text never explicitly mentions Taiwan, “fishing entities” generally include it. While the international community does not recognise Taiwan as a sovereign state for the purposes of membership in international governmental organisations that require statehood, its designation as a “fishing entity” in the UN allows Taiwan to navigate challenges related to its political status while participating in RFMOs.

Taiwan’s first full RFMO membership in the Western and Central Pacific Fisheries Commission (WCPFC) in 2002 marked a significant milestone for the island, given its historically limited involvement in RFMOs. However, Taiwan is designated as “Chinese Taipei,” and the WCPFC Convention conferred upon Taiwan rights and responsibilities similar to those of states holding Contracting Party status, yet as a non-contracting party but a member, Taiwan has a limited range of rights. For example, it is ineligible to serve as chair or vice-chair, determine the Commission’s headquarters, or appoint the executive director. Otherwise, it participates fully in the WCPFC’s workings.

China is a relatively new player in the tuna industry, having begun in 1988 with only a handful of longliners. However, it took them a couple of decades to venture into the significantly more lucrative “industrial” purse seine fishery. This fishery was not part of their traditional expertise, so they needed to develop their knowledge over time, and China excels at this. They play the long game.

The role of tuna fisheries has gradually expanded, often starting as an extension of a fishery in which Chinese nationals have long been involved: the sea cucumber fishery.

Many Chinese nationals residing in the Pacific have maintained connections with fisheries departments for decades. The shift towards “domestic” longlining saw licenses being acquired and subsidised Chinese vessels chartered or flagged under national status, leading to the establishment of numerous “national” fishing companies, albeit with Chinese ownership and funding.

I think the Chinese diplomatic strategy (obviously not “official”) of bankrolling existing domestic fisheries investment, even if in many cases not lucrative… was clever and paid in the long term, as it been seen as locally involved and creating work opportunities, even if when one visits those companies all management is Chinese, and all operators are locals.

These worked better than Taiwanese companies “investing” in their allied countries, usually by flagging a few vessels and paying licenses to fish in domestic waters, sometimes without a locally based representative.

The Chinese strategy of “domestic” investment was then replicated in countries still allied to Taiwan, acting as “trojan horses” to an extent.

For instance, in Kiribati in 2012 (when it was still an ally of Taiwan), a Chinese national established and operated a successful fishing company in Fiji, initially focused on sea cucumbers, then reef fish and longline tuna, subsequently acquiring Fijian citizenship and establishing a joint venture tuna processing plant in Tarawa (Kiribati Fish Limited) as a Fijian citizen. This private company, which was initially located in the former Chinese embassy in Kiribati, became vacant after Kiribati switched its allegiance from China (since 1980) to Taiwan in 2003 KFL made a significant investment in Tarawa, surpassing what any ordinary fishing company could achieve. They constructed a complete wharf extension to set up a state-of-the-art processing factory equipped with waste desalinators—an investment likely costing between 20 to 30 million dollars, beyond the budgets of most fishing companies. Naturally, the company initially operated Chinese-owned yet Fijian-flagged vessels, taking advantage of Pacific Island policies, and later began chartering Chinese-flagged longline vessels to operate under domestic licenses and, in most cases, exit the zone and tranship at sea using the loophole related to the “impracticability exemption” to the prohibition to tranship at sea in the WCPFC, finally, the company also got domestic licenses for Purse Seine fisheries and of course chartered a whole new fleet of Chinese made, flagged and operated. So, basically, for a country that did not have relations with China, most of the resident commercial fisheries activity and investment was Chinese, and no doubt a lot of slow but constant pressure was applied behind the scenes.

I do not doubt that not all the investments were privately backed, and KFL must have “lost” astonishing amounts of money over the past decade.

However, by the time Kiribati reverted to China in 2019, the tuna aspect of the diplomatic relationship was operating at full capacity. This happened so quickly that a new joint venture was established on Kiritimati Island, situated on the other side of a nation on an island of immense strategic importance.

Kiribati excels at navigating geopolitics. British colonialism was quite brutal to them, depleting Banaba Island of phosphate and using Kiritimati for nuclear testing. Fisheries account for 80% of their earnings, and they are experts in this field. I have thoroughly enjoyed working there and greatly respect the fisheries leaders; I am incredibly proud to have earned their trust.

If the individuals engaged in the same geopolitics were Westerners, they would be celebrated as diplomatic legends; yet if they are islanders, they are regarded as either corrupt or too “innocent,” or both... This is entirely unjust.

In fact, they are treated with the same paternalistic attitude now as they were during the USSR era. New Zealand’s Prime Minister David Lange was particularly vocal in 1985, arguing that small island states like Kiribati “lacked the capacity” to defend themselves against larger powers like the Soviet Union—the same argument that, 40 years later, is now being used about China.

Yet, is the situation the same today? Not really… The Pacific Islands are institutionally much stronger than they were 40 years ago. They have played the game for over four decades, mostly in unison. However, China is now part of the landscape as well. Interestingly, back in 1985, when the USA, NZ, and Australia were upset, China offered Kiribati aid worth US$350,000 (1985 values) and interest-free loans for developmental purposes.

Since then, China has maintained missions across the Pacific Islands region. It has successfully established its influence in the area with virtually no objections from Western alliance countries until less than a decade ago, largely because China was not regarded as a threat like the Soviet Union once was.

Furthermore, this includes a commitment to developing billions of dollars worth of infrastructure (such as ports, airports, and electricity). Again, there will be no meddling in local politics, transparency, etc., just lots of money invested in activities that benefit (some) locals and their goal of establishing China’s long-term interests in the country.

Now, returning to the present, does China possess the “power” to serve as the leverage point that the USSR had over the USA during the Cold War? More importantly, can the PICs perceive China as a counterbalance to Western geopolitics and, critically, vice versa? Yes and no… China is undeniably a significant player in the geopolitical landscape, and the USA’s isolationism (particularly under the current government) plays into China’s strategy.

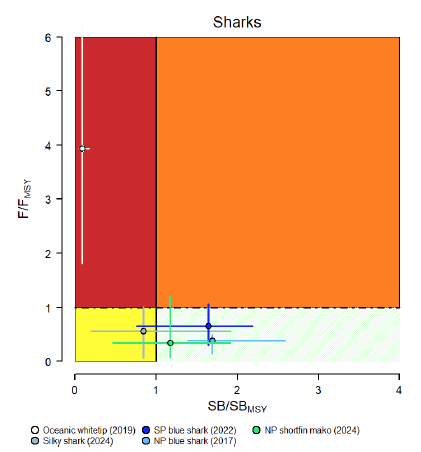
Regarding tuna fisheries in the WCPO, particularly in compliance and IUU fishing, China is neither worse nor better than others, particularly considering its current fleet size.

Nevertheless, the dominant narrative in the USA portrays China as the source of all malevolence. This does not accurately represent the reality we observe concerning significant non-compliance per vessel in our Vessel Compliance Index at FFA.

Once again, this does not imply that China is an innocent player. On the contrary, it vigorously pursues its interests, just as the USA has and continues to do. Therefore, the opportunities for PICs to navigate the delicate balance between the two will become increasingly intricate, as allying with just one means losing leverage with the other.

Unfortunately, as I wrote here, when the USSR disappeared, the movement of non-aligned countries somehow lost its independent voice… and became an echo chamber for authoritarians.

The Non-Aligned group (which still exists and is headquartered in Indonesia, albeit having been dormant since 2019) was the original “third world” concept.

While the concept now means poverty, the name wasn't an insult but a sign of hope for the countries that first came together to form the Third World. The US led the capitalist West, and the USSR led the communist East. The Third World, on the other hand, was neither the First World nor the Second World. It was made up of newly independent states that believed in a world that was neither capitalist nor communist.

The Third World was thus not a place but a project.

While the situation today is different, and it seems that being a “communist” equates to having a social conscience, I believe a revamped “non-alignment” movement is primarily based on the choice not to be in between two forms of autocracies.

This is where “tuna diplomacy” demonstrates that the potential for a refreshed “non-alignment” is real and achievable, mainly if it receives support from developing countries in Latin America, East Asia, and even the EU, New Zealand, Japan and Korea.

It feels like the idealistic “market forces” that have driven development and alliances since the Cold War are currently "off the table". The alternatives seem to establish free trade agreements where China can either offload subsidised products or pay tariffs to export to the USA (which largely lacks free trade agreements)

So, instead of focusing on the failings of individual countries, the Third World project can again aim to reform the global system and ensure that the flow of global wealth is not unidirectional and tied to ideologies fostered by a handful of countries out of almost 200.

[1] Paul D'Arcy (2014) The Chinese Pacifics: A Brief Historical Review, The Journal of Pacific History, 49:4, 396-420, DOI: 10.1080/00223344.2014.986078

What I have learned from Tuna Diplomacy - Part 1 by Francisco Blaha

Although the term "tuna diplomacy" has been used for some time, I first encountered it through my friend Dr. Transform Aqorau. I read about it in 2015 in the book “The New Pacific Diplomacy”, which featured a chapter titled “Tuna Diplomacy" and an article by Transform.

Recently, I used that concept and was asked, "What is Tuna Diplomacy?” I provided a vague description of a vast topic. So, yes... this is my attempt to write and respond.

Before I delve into this, I’d like to qualify my opinion from two critical angles:

  1. I am not a Pacific Islander; I have lived and worked in the region for over half my life (since 1991), so I consider myself a guest rather than a host. I have been honoured to converse with the people I work alongside, but not on their behalf. The era of colonisation, during which others presumed to know what was best for the locals, should have concluded with independence. 

  2. I am not a diplomat; I am primarily a fisheries operational advisor. I am keenly interested in policy, history, and geopolitics.

As Transform said: “The geopolitical underpinnings of the region’s tuna management provide an interesting backdrop to this analysis”.

All of the world’s major trading nations are involved in this fishery: Japan, South Korea, the United States, the EU, and China. Japan has the longest history in the region’s tuna fishery, while recently, China has emerged as a significant player. The region’s tuna resources have become a central focus for advancing the strategic geopolitical interests of these powers. Access to these resources affords them a physical presence over a vast geographic area of the Pacific, from which they can pursue their strategic interests aims.

Here is the first thing I learned, which is a direct consequence of what I believe to be the first tenet of tuna geopolitics, particularly in an RFMO setting: “If you have a presence, you have rights.” This tenet permeates the existence of fleets in numbers that may exceed the economic basis for fishing and justify subsidies. It also establishes the next tenet I have learned: “There are no permanent friends, no permanent enemies, only permanent interests.”

Tuna diplomacy plays a significant role among Pacific Island Countries (PICs) and underpins the relationships between DWFNs and PICs. It is often connected to fisheries, historical, and cultural ties.

The two sides' wildly differing economic development statuses impact the interests of PICs. Access to fish is linked to disputes and the imposition of conditions for global trade, equitable development, climate change, and state sovereignty. Yet the “ownership” of tuna harvest rights has led to PICs winning disputes against much larger nations.

However, this perceived "strength” arising from South Pacific regionalism is relatively recent within the context of the international rules-based system. Until recently, most PICs were colonies of America or Europe. Decolonisation took place across the region, commencing in the 1960s and continuing into the 1980s.

It is easy to overlook that the Pacific Islands Forum (PIF)—the premier regional institution—was established in 1971. In the following years, its membership expanded as more PICs achieved independence. The Pacific Islands Forum Fisheries Agency (FFA), an independent offshoot of the PIF, commenced operations in 1979. It is considered the cornerstone of the essential framework that enables PICs to manage, control, and develop their tuna fisheries effectively.

A subgroup of the FFA wields the most significant influence over tuna diplomacy—the Parties to the Nauru Agreement (PNA), which, while established in 1982, arguably began to demonstrate their power in 2007.

The PNA consists of eight Pacific Island nations that collectively manage 14.3 million square kilometres of ocean within their exclusive economic zones. Consequently, the PNA oversees harvesting nearly half of the tuna canned globally.

With the negotiation and establishment of the Vessel Day Scheme in 2007, they altered how DWFN accessed tuna rights and fished critically in the High Seas pockets, effectively undermining the freedom of high seas fishing in those areas through cartel-like pressure: “Of course, you are permitted to fish there… but if you do, you won’t fish in our waters ever again. Your choice.”

However, they crucially revised the South Pacific Tuna Treaty (SPTT) to compel the USA to alter a long-established, nearly exploitative tuna-for-aid agreement.

While the USA now adopts a more proactive approach to fisheries compliance and specifically targets China for its fleet size and political manoeuvring in the Pacific, it was not long ago that the USA played the bully.

Between 1982 and 1994, PICs played a vital role in negotiating, signing, and ratifying the UN Convention on the Law of the Sea (UNCLOS). UNCLOS consolidated earlier maritime law treaties by defining the exclusive economic zone (EEZ) as a 200-nautical-mile extension of a nation's maritime territory while outlining sovereign states' development rights. Regarding tuna fishing, the EEZ grants PICs authority over who can fish in their waters and the fees they must pay.

A fundamental truth of international law is that it only binds parties that consent to the convention, and non-signatories are not obliged to adhere to it. While UNCLOS is the most ratified agreement globally (168), it took some time to achieve acceptance.

The USA has not ratified UNCLOS; therefore, in the early 1980s, American fishing vessels operated within the EEZs of various small island states. From the perspective of PICs, which were signatories to UNCLOS, this infringed upon their sovereignty and had economically detrimental effects. Interestingly, the USA remains one of 14 countries that have yet to ratify UNCLOS and is the only developed nation that has not done so.

To challenge the illegal American presence in their maritime territory, US fishing vessels were apprehended for illegally fishing in the waters of PNG in 1982 and the Solomon Islands EEZ in 1984, which subsequently led to the imposition of a retaliatory (and crippling) US embargo.

The FSM threatened to blacklist the USA-flagged Purse Seiner Ocean Pearl when the crew warned they would drop a speedboat rigged to her boom onto a boarding party after being caught fishing illegally. Specifically, sightings of US purse Seiners illegally fishing within Kiribati's territorial waters were common. Several helicopters used to scout for tuna landed on various outer islands without clearance. Notably, the USA-flagged Purse Seiner Carol Linda ran aground while engaging in fishing activities well inside Kiribati's territorial waters. Furthermore, in 1987, an RNZAF Orion reconnaissance aircraft photographed 10 purse seiners in Kiribati waters involved in fishing. Despite vigorous protests (and evidence of wrongdoing), the US Government did nothing, preferring to view any interference by Kiribati as an "act of hostility". Kiribati eventually responded to the USA's provocations, employing a blend of tact and cunning to apprehend the Purse Seiner “Tradition”. Caught in the act with fresh fish in her hold, the vessel's owners had no choice but to plead guilty. Fines exceeded USD 300,000, and the vessel was sold back to her owners for USD million.

This communicated a message to the other young PICs through the subsequent enforcement of sanctions under the Fishermen's Protective Act and the Fishery Management and Conservation Act. These laws offered compensation to USA tuna fishermen whose vessels were confiscated for illegally fishing in the fisheries zones of other states. They included provisions for imposing an embargo on importing fish products from any country that confiscates a USA fishing vessel for taking tuna without a license.

Unlike the PICs and other nations, the USA maintained (or at least at that time) that highly migratory species, particularly tuna, do not fall under the exclusive jurisdiction of coastal states beyond 12 nautical miles from their shores. The official reasoning behind the USA's position is that, due to the vast distances these highly migratory species cover and their crossing of numerous nations’ waters, they would be managed more effectively by an international body comprising coastal states and DWFNs.

However, this occurred during the Cold War, making diplomacy with Moscow a form of resistance. Kiribati, possessing the largest EEZ in the Pacific, took the initiative and negotiated a fisheries access agreement with the Soviet Union in 1985. Vanuatu soon followed in 1986, while PNG and Fiji were included on the list.

This represented a masterful economic and strategic move for Kiribati. Consequently, all other PICs were able to express their disapproval of the American stance on tuna fishing and their intention to pursue similar agreements with the Soviets.

The fear of Soviet expansion in the Pacific—an area that America has always viewed as its backyard since the annexation of Hawaii, the acquisition of islands through the Guano Act, and its occupation during the Second World War—ignited national security concerns not only in the USA but also in New Zealand and Australia. This particularly elevated the establishment of a South Pacific desk in the Soviet Foreign Ministry, an embassy in Vanuatu in 1986, and diplomatic relations with Papua New Guinea.

Ironically, the key objections for the USSR in 1985 could mirror the ones to China in 2025… that is it could lead to the establishment of Soviet military and intelligence bases in the countries with whom they signed the agreements, and ultimately in the whole of the South Pacific.

Certainly, this was rather ludicrous and exaggerated by the USA. At that point, the Soviet Union had been fishing in the WCPO for decades, and importantly, it overlooked the fact that the Soviet Union had maintained a fisheries agreement with New Zealand since 1978. Furthermore, it perpetuated the paternalistic postcolonial notion of "we know what is better for you," suggesting that the PICs lack the necessary sophistication to exercise what is, after all, a sovereign right, which is an affront to their sovereign integrity.

Cornered, the USA ultimately concluded the so-called "Tuna Wars," marking a significant victory for the PICs and tuna diplomacy. However, other challenges loomed on the horizon. In the 1980s, the global tuna industry, following Japan and the USA, began to venture into the Western Pacific due to supply constraints resulting from overfishing in the Atlantic and Mediterranean and growing demand from consumers in Europe and the US.

In 1988, the South Pacific Tuna Treaty (SPTT) was ratified, involving 17 Pacific nations, including Australia and New Zealand. The SPTT provided these nations with US$12 million annually, comprising US$10 million contributed by the US government and US$2 million from the industry.

Eighty-five percent of this total would be allocated to countries according to the quantity of tuna caught in their waters. Simultaneously, the remainder would be distributed equally through aid and various technical assistance programmes.

In return, Pacific states would ensure that US vessels had ample time in the water. The geopolitics that brought the United States to the negotiating table highlight the political acumen of the PICs; however, the collapse of the Soviet Union undermined their negotiating power in subsequent engagements, and the USA began to apply pressure once more.

In the 1980s, global catches of tuna and tuna-like species weighed roughly 2.5 million tonnes. By the 1990s, this figure increased to about 4.5 million tonnes, and by 2010, it was approximately 6.5 million tonnes.

By 2008, the SPTT's contribution had only increased to US$18 million, along with a US$5.7 million contribution from the industry for a region producing 2.5 million tonnes. This Tuna treaty was more than incongruent with the industry's growth trajectory.

An FFA study at the time highlighted that 60% of the global catch comes from within the EEZs of PICs, representing an 8—to 10-billion-dollar industry. However, for various reasons related to economies of scale, geographical isolation, and limited resources, most of the profit generated from these catches escapes the region to foreign canning facilities in Southeast Asia and Latin America, where it is distributed for consumption in the EU and the US.

As mentioned before, in 2007, the PNA implemented the Vessel Day Scheme (VDS) as a means to gain greater control over their extensive natural assets by altering how their primary clientele, the international fishing industry, accessed their waters.

Before the VDS, international fishing fleets (excluding the USA) paid a fee based on the expected weight of their catch. This payment method resulted in inconsistent income levels, which created challenges for PICs, as they had limited monitoring capabilities at that time and relied heavily on the revenues generated from tuna.

The VDS limits the number of fishing days per year the industry can operate within PNA waters and requires international fisheries to bid for these time slots to fish. This change has generated consistent and higher incomes for the tuna-dependent economies of the Pacific. Initially, prices were set at US$ 1,200 – US$ 2,500 per day during the 2007-2011 period; however, with early success, price floors rose to US$ 5,000 in 2012, then to US$ 6,000 in 2013, and to US$ 8,000 in 2014, continuing above US$ 12000 at present (possibly indicating a natural ceiling).

Critically, from 2010 until now, the income generated by VDS rents and related programmes has surged fromUS$50 million to an estimated US$900 million.

The VDS was established under the legal framework of UNCLOS, which provided PNA countries with a basis to implement the scheme and exercise their rights to restrict access to EEZs in response to non-compliance.

Except for the USA (which is still under the SPTT), this robust domestic enforcement mechanism significantly enhanced these governments' capacity to negotiate terms and compel firms to adhere to them. So in time, the SPTT became a suboptimal deal within the context of the PNA because it guaranteed American vessels time on the water, significantly lower than VDS rates. For example, in 2011, Japanese fleets paid an average of US$ 6,050 per fishing day, whereas their American counterparts, through the SPTT, paid US$ 1,800 per fishing day.

This discrepancy halted the renegotiation of the SPTT in 2011, when Papua New Guinea unilaterally withdrew from the process and began the nullification of the treaty in 2012. Although a few more years were agreed upon, the end was inevitable.

From the USA's perspective, the SPTT served as the cornerstone of its commercial and developmental relationship with the region, aside from USAID. In the wider geopolitical context, the Obama administration was shaping its pivot to Asia foreign policy.

This "Pacific-centred” policy instigated significant drama and even prompted a process of retaliation from the USA. For instance, a bill was presented to the US Congress on 1 February by two Republican members. It explicitly states, "PROHIBITION ON ASSISTANCE TO FOREIGN COUNTRIES THAT ARE PARTIES TO THE SOUTH PACIFIC FORUM FISHERIES AGENCY CONVENTION"... a genuinely vindictive piece of legislation... a true "lowlight" of foreign policy and geopolitics, and (once again) very indicative of the US's attitude in dealing with this.

To restart negotiations, Washington proposed US$58 million for 9,000 fishing days, much closer to the demand of US$60 million for 7,000 fishing days. With communications restored and a motion passed to extend the negotiating period, an agreement was finalised in 2016. The PICs received US$21 million in aid and agreed to pay US$12,500 per fishing day through the revised SPTT.

Finally, in 2023, the US Congress passed the South Pacific Tuna Treaty Act, which amended the 1988 SPTT to incorporate the 2016 amendments. Consequently, the SPTT was extended in 2024 and is set to last until 2033 at more realistic income levels for PICS. Yet, who knows what might happen with the current government? If things go awry… There is no longer a USSR to leverage, but there is China, which is well-represented and mastering the game.

The primary lesson is that analysing the three negotiation periods for the SPT reveals that small island states diligently defend their rights and interests against the USA in areas such as sovereignty, trade, and international law.

In 1988, the Pacific Islands had inexperienced institutions and little power to negotiate beyond their waters. To encourage the Americans to engage in discussions about a trade deal, they leveraged the external threat of significant Soviet involvement. By 2011, the success of the VDS demonstrated that robust internal networks had been established. These networks enabled Pacific nations to collaborate, thereby enhancing their power in negotiations with more prominent players, including the USA, the EU, Japan, Taiwan, Korea, and, increasingly, China. At the same time, they now dominate the bargaining table, compelling others to join the negotiations.

But now China excels at long-term strategy and is undoubtedly familiar with the region.

Part 2 of this blog will focus on China and what lessons from the Soviet deal are relevant to the present.

The Vicissitudes of “electronic evidence" part 3:   Admissibility by Francisco Blaha

Continuing with the series on electronic evidence, this is the third and last topic I take on: Admissibility. (the quality of being acceptable or valid, especially as evidence in a court of law)

As said in the previous blogs, this is an interest of mine, and I'm learning from Professor Andrew Norris work.

Each nation will have distinct and unique components within its overall evidential practice. Admissibility considerations, including those for electronic evidence, will largely be universal and standard across nations. Therefore, the discussion will likely apply to all nations and jurisdictions, subject to each nation’s unique terminology and variations.

Melvin using MIMRA’s tools to guarantee admissibility.

 The general admissibility of evidence

Numerous factors can influence the admissibility of evidence, whether electronic or otherwise, in an adjudicative forum. A fundamental and unchanging requirement is that evidence must be relevant to a matter at issue in an adjudication. However, even if evidence is relevant, it may still be considered inadmissible for various reasons:

  1. its probative value may be overshadowed by the risk of undue prejudice or potential confusion if permitted;

  2. The proponent did not adhere to the rules of discovery or any other pre-trial disclosure requirements the evidence may contravene hearsay rules;

  3. There may be inquiries concerning its authenticity.

  4. The evidence may violate principles of fundamental fairness (for instance, evidence of a defendant’s general character or prior bad acts may not be admissible to prove that he or she committed the acts charged in a particular proceeding);

  5. The evidence may be protected by privilege rules (such as spousal or medical privilege); the evidence may consist of inadmissible opinions;

  6. The evidence may be excluded due to the government’s illegality in its acquisition or exploitation, usually owing to a breach of search and seizure regulations and

  7. The evidence may not be presented in a manner required by the rules of evidence (for instance, the original document rather than a copy).

The admissibility of electronic evidence

Electronic evidence is, after all, still evidence; therefore, the same considerations outlined in subpart A apply to both electronic and non-electronic evidence. However, specific admissibility considerations are more prominently featured with electronic evidence. Moreover, unique aspects of electronic evidence do not exist with non-electronic evidence, which have potential admissibility ramifications.

Some unique aspects of electronic evidence

Digital or electronic information can be stored in any of the following: mainframe computers, network servers, personal computers, handheld devices, automobiles, or household appliances; alternatively, it can be accessed via the cloud, the Internet, private networks, or third parties. Most such information is generated and maintained in the normal course of business. As a result, discovering relevant and non-privileged data is routine and falls within the generally accepted scope of hearsay rules. Other data are generated and stored as a byproduct of various information technologies typically employed by parties in their ordinary business activities, though these are not usually retrieved and used for business purposes. Such data include the following:

  • Metadata, or ‘information about information’, encompasses the data embedded in a routine computer file, reflecting the file's creation date, when it was last accessed or edited, by whom, and sometimes previous versions or editorial changes. This information is not visible on a screen or in a standard file printout, and it is often generated and maintained without the user's knowledge.

  • System data refers to the information generated and maintained by the computer itself. The computer records a variety of routine transactions and functions, including requests for password access, the creation or deletion of files and directories, maintenance functions, and access to and from other computers, printers, or communication devices.

  • Backup data are generally stored offline on tapes, disks, external hard drives, or in the cloud. They are created and maintained for short-term disaster recovery rather than for retrieving specific files, databases, or programmes. These tapes or disks must be restored to the system from which they were recorded or to a similar hardware and software environment before any data can be accessed.

  • Files purposefully deleted by a computer user are seldom entirely erased from the computer’s hard drive. Instead, the operating system renames and marks them for potential overwriting if that specific space on the hard drive becomes necessary. Recovery of these files typically requires expert intervention.

  • Residual data exists in bits and pieces throughout a computer hard drive. Similar to the data found on crumpled newspapers used for packing shipping boxes, this data is also recoverable with expert intervention.

 Concerning admissibility, there are certain features common to all electronic evidence:

  1. in every case, there will be some device involved (hardware)19;

  2. in every case, there will be some level of programming, code, algorithms, etc. that tells the device what to do (software); and

  3. In all cases, evidence will be captured, stored, or transmitted in some way, as described.

Since these aspects are common in the generation, storage, transmission, and utilisation of electronic evidence, they cannot, on their own, act as a distinguishing factor for the admissibility of such evidence.

However, the nature of the device used, details about its software, and the methods of transmission, storage, and retrieval will undoubtedly be significant factors in determining the admissibility of electronic evidence. These factors ultimately affect the authenticity of the evidence.

Along with authenticity, the legality of how the evidence was obtained will be a crucial consideration for admissibility, as will adherence to hearsay and other rules designed to improve the reliability of evidence, whether electronic or otherwise.

THE VICISSITUDES OF "ELECTRONIC EVIDENCE" IN FISHERIES CASES - PART 2 by Francisco Blaha

Following my last post on electronic evidence, I will go to part 2, which presents some key terminology and a typological framework for maritime evidence admissibility.

As I mentioned in my last post, I am not well-versed in this area; nevertheless, I find it exceptionally interesting. As part of the "process" of gathering and securing evidence, I continue referencing Professor Andrew Norris's excellent study (previously cited) on how digital evidence related to maritime crime cases can be presented in court, forming this post's basis.

Beau is acquiring evidence

Terminology and Related Concepts

In any analytical product, there must be a common understanding of the essential terms of art necessary to understand the process, analysis, and conclusions related to that product. To this end, basic definitions are provided below.

Digital (electronic) evidence - Digital evidence is ‘information and data of value to an investigation that is stored on, received, or transmitted by an electronic device’.

Device evidence - Evidence autonomously produced by a ‘device’ by its programming in the form of computer code that ordinarily is fixed and that can be examined. No human being controls the production of the evidence; instead, the device produces the data.

There are three types of device evidence:

Type 1 (Devices that store data): These devices are limited to collecting and storing data. They typically function rule-based and produce data according to their fixed coding. Unlike Type 2 or Type 3 devices, they do not act on, analyse, or classify that data.

Type 2 (Devices that can evaluate and act on data) - Devices that can draw conclusions from the data they gather and act on those conclusions, having been trained to tackle specific tasks using algorithms and statistical models. They apply their insights to new situations without following explicit instructions. The hallmark of Type 2 devices is a digital layer of “intelligence: enhanced through machine learning, which allows them to evaluate data and determine when and how to act on their assessments. Examples include software that monitors the location of specific individuals or objects, such as fitness trackers, Google Earth, or GPS devices, as well as smart robotic vacuum cleaners that "identify" and avoid obstacles like toys, pet waste, or cords.

Type 3 (Devices with capacity for self-modification) - Type 3 devices, also known as Artificial Intelligence devices, can employ specific, self-optimizing, highly complex machine-learning to modify their own operations based on their ‘experience.’ Examples encompass smart grids, self-driving cars, and facial recognition devices, from smart doorbells to advanced identification systems that can not only adapt but also optimise their own code.

Acquired evidence - Evidence generated by the subjects of an adjudicative proceeding and obtained by government agents.  An example of ‘acquired’ electronic evidence may be waypoint or other information stored in an electronic chart to prove the suspect vessel’s location or activities.

Generated evidence—Evidence created by law enforcement agents, such as video shot by government agents to document the location of suspected contraband discovered aboard a vessel. An example of generated evidence is when government agents may forensically exploit or use evidence to create electronic (digital) evidence that has derivative yet independent evidentiary value, such as DNA match testing conducted on samples collected on board.

Forensic evidence - It requires some advanced processing before its full evidentiary value/potential can be realised.   

 Typological Framework for Maritime Evidence Admissibility

According to the UNODC e-book ‘Maritime Crime: A Manual for Criminal Justice Practitioners,’ 3rd ed., Section 5.1, maritime law enforcement (MLE) includes the following non-exhaustive sequence of actions:

  1. Signalling and stopping suspect vessels;

  2. Boarding suspect vessels;

  3. Searching suspect vessels and the people and cargo in such vessels;

  4. Detaining or arresting people in suspect vessels and/or the suspect vessels themselves;

  5. Seizing items on suspect vessels;

  6. Directing or steaming suspect vessels and the people and cargo in those vessels to a coastal State port or similar place for investigation;

  7. Conducting such investigations; and

  8. Subsequent prosecution or other forms of administrative action or sanctions.

This list does not include detecting suspicious activity that kicks off the MLE operation.

The prosecutor primarily acts as the ‘end-user’ of evidence, which is mainly, if not entirely, collected by other officials in the enforcement chain. All these officials must understand the requirements for the admissibility of any evidence, whether electronic or otherwise, that they may gather for potential adjudicative purposes. This understanding can be complicated by discrepancies in how evidence is collected, who collects it when it is collected, where it is collected, how it is collected, and for what purpose.

Considering all these factors requires a systematic approach. Electronic evidence types or categories should be organised to facilitate an orderly examination of the relevant admissibility considerations should the evidence be presented in a national tribunal. This systematic approach will benefit not only prosecutors but also those within the enforcement chain, who are responsible for gathering and producing admissible evidence that prosecutors can use to achieve a successful legal outcome.

To this end, Professor Norris proposes a six-category scheme for classifying electronic evidence in an MLE case based on the differing admissibility considerations for evidence collected within each category. For ease of conceptualisation, the categories are arranged sequentially; that is, they reflect the progression of a case from the detection of suspicious activities through interdiction, acquisition of evidence, processing of evidence, and presentation of evidence in an adjudicative structure aids operators in illustrating and organising the broad spectrum of potential evidence that may be gathered in an MLE case. However, evidence in each category possesses different admissibility consideration proceedings.

The 6-category Typological Framework for Maritime Admissibility is as follows:

Category 1 (‘Remote awareness’)

Category 1 evidence (‘remote awareness’) is generated through remote electronic means and is used in specific cases to detect and monitor suspicious vessel activity that may lead to the dispatch of an enforcement asset to the scene for further investigation. Examples of electronic systems that may be employed, either individually or in combination, for this purpose include AI/ML-enhanced systems (such as Skylight, GFW, Starboard, etc.) based on the Automatic Identification System (AIS), Vessel Monitoring System (VMS), and shore-based radar.

The primary purpose of Category 1 evidence is to identify a suspect vessel or activity and potentially guide an enforcement unit to the scene; it would not be used in any subsequent adjudicative proceedings to prove a case or an element of an offence (this use would categorise it as Category 2 - see below). As a result, evidence in this category is seldom regarded as evidence, as there is no intention to use it in that capacity. In fact, rather than wishing to incorporate it into its case-in-chief, the government may be particularly keen to avoid disclosing it, as doing so could compromise sensitive capabilities, sources, and methods.

Category 2 (‘Remote Proof’)

Category 2 (‘remote proof’) evidence is identical to the evidence in Category 1, with the only distinction being that the government intends to use it as evidence in a subsequent adjudicative proceeding to prove a case or an element of an offence. Circumstances in which the government may wish to do this include: (1) proving the vessel’s location when that may be relevant to an element of an offence (did the fishing vessel enter the EEZ? Did it transit through a marine protected area in violation of coastal State laws?); (2) demonstrating suspicious activities the vessel was engaged in (loitering, going dead in the water, vessel movements consistent with IUU fishing, etc.); (3) establishing that an at-sea rendezvous involving the suspect vessel and another vessel or vessels took place, where, for instance, the other vessel is found to be carrying contraband believed to have been supplied by the suspect vessel; and (4) related information (duration and location of suspicious activities etc.).

Category 3 (‘Enforcement unit generated’)

Category 3 (‘enforcement unit generated’) evidence refers to electronic evidence produced by the enforcement unit and/or supporting units, such as aircraft, drones, and other resources collaborating with the enforcement unit. This evidence serves to (a) document activities related to the suspect vessel that are observable from the enforcement unit and (b) document the activities of the enforcement unit and its personnel that can be perceived from outside the suspect vessel. The key aspect of the evidence in this category is defined by what it is not—it is not collected while aboard the suspect vessel itself (as that falls under Categories 4 and 5 evidence). Instead, it comprises evidence gathered by enforcement units and their personnel from external vantage points relative to the suspect vessel.

Examples of Category 3 evidence include: (1) video footage captured by the enforcement unit that records suspicious behaviour by the crew of the suspect vessel or the vessel itself; (2) audio recordings of communications from the enforcement unit to the suspect vessel, along with any responses from the suspect vessel; and (3) photographs and/or electronic captures of electronic charts, GPS readouts, and similar documents aboard the enforcement unit to document vessel locations and other potentially critical information.

Category 4 (‘Suspect vessel, acquired’)

Category 4 (‘suspect vessel, acquired’) evidence, alongside Category 5 (‘suspect vessel, generated’) evidence, comprises electronic evidence collected by enforcement unit personnel aboard the suspect vessel. Originating from the suspect vessel—that is, the self-contained vehicle involved in the commission of an offence—evidence in this category, as well as in Category 5, regardless of whether it is electronic or not, is likely to be the primary evidence upon which the government will rely to substantiate its case in any subsequent adjudicative proceedings. The principal difference between Category 4 and Category 5 evidence is that the former is located or discovered by enforcement personnel, while the latter is produced by them (as with Category 3).

This distinction carries several potential implications for admissibility: (1) there are significantly greater search and seizure ramifications associated with electronic evidence generated and held by criminal suspects compared to electronic evidence created by government agents, primarily aimed at enhancing the likelihood of successful prosecution; and (2) it is highly improbable that government-generated evidence during an MLE boarding will need forensically analysing to determine and fully comprehend its evidentiary usefulness, whereas electronic evidence generated by the suspects—and the systems used to create it—may well necessitate some level of forensic analysis to unlock its full evidentiary significance.

Thus, although both Category 4 and 5 evidence is obtained from the suspect vessel, the separate and distinct evidentiary considerations arising from the distinction between “acquired” and “generated” evidence warrant two separate categories.

Furthermore, it should be noted that only electronic evidence that the government can use without further extraction, manipulation, or forensic analysis will fall into Category 4. If additional forensic analysis is required before the evidence can be accessed (by breaching an encrypted system) or fully comprehended, utilised, or developed (through the forensic analytical process), it would be classified as Category 6 rather than Category 4.

Category 4 evidence may encompass data found in systems or equipment aboard a vessel, such as (1) computer systems, laptops, and mobile phones belonging to the suspects; (2) data stored in electronic charts that document the suspect vessel’s movements and activities; or (3) electronic logbooks, if they exist.

Category 5 (‘Suspect vessel, generated’)

Category 5 electronic evidence generated by enforcement personnel during this phase may include videos, photographs, and audio recordings that document various aspects such as (1) the actions of law enforcement personnel to protect against subsequent allegations of irregularities in search and seizure,
 excessive use of force and other human rights concerns; (2) the location, stowage arrangements, and other evidentially helpful information related to contraband or the fruits of crime discovered on board the vessel; and (3) crew actions and behaviours that might for instance, illustrate mens rea, such as knowledge (for example, of the contraband's location), as well as indicate who held a leadership role or was in charge, etc.

Category 6 (‘Forensically analysed’)

Category 6 (‘forensically analysed’) evidence requires forensic systems to access, understand, analyse, and/or generate. This category's essence lies in needing specialised equipment, processes, and trained personnel to access or generate evidence otherwise unavailable for governmental use in an adjudicative proceeding. Simply needing expert testimony to introduce digital evidence does not suffice for categorisation into Category 6; all ‘acquired’ and possibly some “generated” electronic evidence will necessitate some expert testimony in response to defence challenges regarding authenticity, reliability, etc.

To qualify for Category 6 — which is its very essence — the evidence in question requires further processing to either access it or to realise and develop its evidentiary value fully. This distinction is crucial, as the additional forensic analysis introduces further admissibility requirements for Category 6 evidence absent in other categories.

‘Forensically analysed’ evidence encompasses the involvement of forensic systems to:

Access the evidence: locked and/or encrypted devices may require forensic analysis simply to bypass encryption and obtain the evidence contained within;

Further develop acquired evidence: the government may seize a device (such as a laptop or mobile phone), which requires forensic analysis to uncover or recover all relevant information. Examples include recovering deleted communications from a seized device, determining whether an external device has been connected to a computer (the Windows registry automatically records information about every USB device plugged into the computer), or proving online activities by matching an individual’s IP address to information automatically captured on a website server’s Internet Information Systems (IIS) logs.

The vicissitudes of "electronic evidence" in fisheries cases - Part 1 by Francisco Blaha

Since I started collaborating with Ocean Mind in 2017, I have been very interested and active in the work of “fusion platforms.” I collaborated with Global Fishing Watch for a bit, then for the last 4 years, with Starboard.nz right from their inception. (There is also Skylight)

These Maritime Domain Activities (MDAs) data-receiving, processing, and presentation platforms have become pivotal in ensuring compliance. By utilising satellite imagery, AIS/VMS, artificial intelligence (AI), and its subset, machine learning (ML), and enhanced by computer vision technologies, these fusion platforms provide the capability to analyse large volumes of data to identify patterns and detect anomalies. Algorithms can examine present and historical data to predict potential compliance risks, enabling proactive risk management.

Analytics from the fusion platform can provide risk insights, improve report accuracy, and reduce time and resource requirements. This enables diverse stakeholders across multiple jurisdictions to decentralise work. the Sunflower 7 case and some of our cases in RMI prove their utility.

Yet, in reality, and perhaps thankfully, in the WCPO we never had to test their use in court cases. The fact is that in fisheries, you tend to settle out of court… ideally because the evidence is soo good and overwhelming that the vessel owner swallows the pill and settles to get back fishing, but as well that in the case of a foreign vessel, most flag states don’t want the case to be dragged into the Technical and Compliance Committee (TCC) of the WCPFC, and petition that the vessel gets into the IUU list and causes “noise and embarrassment”. Also, court procedures are generally complex, time-demanding, expensive, and sometimes politically demanding and taxing.

Yet, if ever… there would be a generalised challenge to the admissibility of ‘electronic evidence’, which is an umbrella term that includes ‘digital evidence’ (anything created or stored in a computer) and ‘analogue evidence’ (paper records, audiotapes, photographic film) subsets.

Additionally, electronic reporting (ER) and electronic monitoring (EM) – cameras on board are becoming increasingly common and ubiquitous in their roles in compliance now.

Although prevalent in society, digital or electronic evidence concepts are relatively new to legal discourse, while Internet or online evidence is even more recent. These terms solely represent the format of information rather than its admissibility as evidence. For example, in the USA they talk about ESI (Electronically Stored Information): any information created, stored, or utilised with digital technology. Examples include but are not limited to, word-processing files, email and text messages (including attachments), voicemail, information accessed via the Internet, including social networking sites, information stored on cell phones, and information stored on computers. At the other end, China’s law specifically addresses electronic evidence

In today's digital world, digital evidence is becoming more common and essential. Such things as emails, digital photos, ATM transaction logs, word processing, papers, instant message histories, files saved from accounting programs, spreadsheets, internet browser history databases, computer memory contents, backups, printouts, GPS (IAS/VMS) tracks, and digital audio or video files are all part of this.

Yet it depends on the rules of evidence in a specific country, which are set up to fit with that country's overall justice system. The rules of evidence decide how much evidence can be used and admitted by its proponent in a criminal or civil case. Because of this, those rules can be interpreted in many ways, making it difficult when involving different jurisdictions… as is the norm in fisheries.

Add to that the very high level of technology used to create, store, send, and use digital proof, which makes it harder to determine whether it can be used in court. Software, programming, and algorithms used in digital evidence are complicated to understand for most people, even software experts.

Data-generating devices don't work like human thoughts or get things done similarly; as such, the evidence may be spread out geographically and often kept on servers in different countries or submitted through networks connecting different jurisdictions with various rules and levels of transparency.

Thankfully, the Initial problems on the suitability of such electronic evidence and worries about the opposing party's ability to successfully cross-examine or otherwise challenge the evidence have mostly been replaced by acceptance and accommodation by most legal systems worldwide. In some systems, the evidence rules haven't changed much, but they've been applied differently to account for the different kinds of proof. At the same time, in other jurisdictions, separate Electronic Evidence Acts (or similar) have been passed to add new rules to the current evidence rules or to go along with them.

As part of a job for UNODC, I’m evaluating the MCS conundrums around MPAs in ABNJ; I came across an excellent study by Professor Andrew Norris (also for UNDOC) on how digital evidence related to maritime crime cases can be presented at courts, and I will be digesting it over a couple of forthcoming posts.

Of course, there are very straightforward cases involving one jurisdiction, newer legislation and a frankly brazen fisherman, as in this case: Fisherman caught on camera disposing of undeclared snapper.  But unfortunatelly, these are the exceptions.


The western and central Pacific tuna fishery: 2023 overview and status of stocks by Francisco Blaha

It comes out a few weeks later than usual, yet SPC’s flagship tuna publication, “The Western and Central Pacific Tuna Fishery: 2023 Overview and Status of Stocks,” is out.

The publication always has well-crafted graphs and tables (Plus now pictures, many of them mine), with some information immediately apparent and others requiring closer reading.

The news still talks about the collapse of tuna fisheries in the Pacific, that the (name your geopolitical nemesis, i.e., China, the US, Korea, Japan, EU, etc.) are taking all the fish, that the regional management organisations are secret, that we need eco-labels to know if fisheries are sustainable, and so on. So… Do you want to rely on the multimillion-dollar spin industry for information, or do you prefer to read a document that links all the scientific evidence supporting their claims?

This document includes an analysis of the fishery by species and fleet type, the impact of climate change and much more.

Like most things in life, there is good and bad news. Some things are going well, while others are not. However, if you look closely, you can see beyond the surface.

If you're reading this blog, it's probably because you're interested in tuna fisheries in the region. SPC is the data and science provider for the WCPFC and has some of the top stock assessment scientists in the world. Therefore, this publication is essential reading for any informed discussion.

What are the things I rescue?

  1. Catch Data Overview:

    • The 2023 catch was 2,623,966 metric tonnes, a 1.3% decrease from 2022, representing 53% of the global tuna catch.

  2. Species-Specific Catch Trends:

    • Skipjack tuna has consistently been the most caught species, with significant contributions from purse-seine and pole-and-line methods, accounting for 62% of the total catch in 2023.

    • Yellowfin tuna catches have shown variability, with a 7% increase from 2022, making up 28% of the total catch.

    • Bigeye tuna catches have shown variability, with a 1% decrease from 2022, making up 6% of the total catch.

    • South Pacific albacore catches are predominantly from longline gear, with a 3% increase from 2022, making up 4% of the total catch.

  3. Gear Type Contributions:

    • Purse-seine: 1,837,030 t (70% of total catch) ​

    • Longline: 227,646 t (9% of total catch) ​

    • Pole-and-line: 111,670 t (4% of total catch) ​

    • Troll: 6,925 t (<1% of total catch) ​

    • Other gear: 440,695 t (17% of total catch) ​

  4. Fishing Effort and Fleet Data:

    • The report includes indices of fishing effort, such as the number of vessels, days, and sets for purse-seine, longline, and pole-and-line fisheries. ​

    • Effort data exclude certain domestic fleets (e.g., Japan coastal, Indonesia, Philippines, and Vietnam). ​

  5. Biological Reference Points and Stock Status:

    • The report provides the latest stock assessments for South Pacific albacore, bigeye, skipjack, and yellowfin tunas, including spawning biomass, maximum sustainable yield (MSY), and fishing mortality ratios.

    • Skipjack, yellowfin, and South Pacific albacore stocks are not overfished and are not experiencing overfishing.

    • Bigeye tuna has a 12.5% probability of undergoing overfishing. ​

  6. Harvest Strategy Development:

    • Progress varies across the four key tuna stocks. ​

    • A management procedure for skipjack tuna was adopted in 2022. ​

    • Interim target reference points (TRPs) and candidate TRPs have been identified for South Pacific albacore and bigeye tuna, respectively. ​

  7. Tagging Projects:

    • Data on the number of tuna tagged and recovered during major tagging projects (SSAP, RTTP, PTTP) are included, highlighting efforts to monitor tuna movements and population dynamics. ​

  8. Ecosystem Considerations:

    • Observer coverage for purse-seine and longline fleets has increased, with purse-seine coverage reaching nearly 60% in 2023. ​

    • Bycatch rates and interactions with species of special interest, such as marine mammals and seabirds, are being monitored and managed. ​

  9. Climate and Ecosystem Indicators:

    • The report discusses climate indices and their impact on the oceanic environment, including sea surface temperature anomalies and the El Niño Southern Oscillation (ENSO). ​

    • Climate change projections for tuna biomass under different greenhouse gas emission scenarios (RCP2.6 and RCP8.5) are presented, indicating potential shifts in tuna distribution and abundance by 2050.

And, of course, my favourite graph

Majuro (top left) and Kobe (top right) plot stock status summary for the four WCPO target tuna stocks and a comparison of Kobe plot stock status for the same four tuna species in the other major ocean basins


These are my least favourites, as both relate to the mess that Longline continues to be in the region (even if it is one of the gears that I liked—and challenged me—the most while fishing commercially until 1998).

The status of billfishes and sharks

In the one below (page 52), you see fishing effort, in fleet sizes and number of hooks fished (bottom), for the longline fishery in the WCPFC.

When I was fishing these waters in 1993/4, it was the heyday of LL in the WCPO, peaking at 5000 vessels. Today, as you can see, there are only around 2000 left, yet they are soaking 200 million more hooks. How can that be possible? Deck and gear setting technology are almost the same.

Response: overworking crew. The workload has been duplicated (and their payment is below 25% of what I was paid at the time in nominal terms)

Now if you really want to get depressed… read the climate change section :-(

The WCPFC adopted the 1st CMM for Crew Labour Standards in the world by Francisco Blaha

As I listen online to the discussion at the 21 WCPFC plenary in Suva, I smile as the Conservation and Management Measure for Labour Standards has been finally adopted.

I should be happy about this, and to an extent, I’m happy.

yeah… better than nothing

Although the adopted text is a diluted version (to almost homeopathic levels) of the original one, which we started 4 years ago, to have a labour CMM is a good starting point.

It has been an exercise in frustration… from day one, most DWFNs (other than Spain) have gone through a lot of trouble and wording not to be held accountable internationally for labour rights violations on their vessels.

It seemed they were forced to discuss this. It was not about the people in the room; it was about the crew, yet they were always on the defensive. Representatives in the discussions constantly went through much trouble and wordsmithing as to not be held accountable internationally for labour rights violations on their vessels.

I've never seen otherwise good people work so hard in opposition to being what I know they are: decent humans beings.

Just one example… in which other jobs in the world will you have developed nations (China, Japan, Korea, USA, TW) opposing that contracts for people working in what is literally their country should not be required to have the elements in italics below… Can a work contract be legal without any of these? Would you be happy for any of you kids to have a job with a contract that does not need to have family name and other names, date of birth or age, and birthplace?

They were ready to walk back from negotiations if, as I originally proposed, the following should be required… they agree to “may”, which means that someone on the board could have a contract with any of the following:

Attachment 1: Particulars that may be included in a Crew Agreement
1.     The crew’s family name and other names, date of birth or age, and birthplace.
2.     The place at which and date on which the agreement was concluded.
3.     The details of the crew member’s next of kin or designated contact person in the event of an
emergency.
4.     The name of the fishing vessel or vessels and the registration number of the vessel or vessels on board which the crew undertakes to work. If the crew member changes vessels, this should be updated by the vessel owner and/or operator in the written contract or agreement with the crew member.
5.     The name and address of the vessel owner and/or operator, or other party to the agreement with the crew member.
6.     Starting date and duration of contract.
7.     The voyage or voyages to be undertaken, if this can be determined at the time of making the agreement.
8.     The capacity in which the crew is to be employed or engaged.
9.     If possible, the place at which and date on which the crew member is required to report on board for service. This should include details of the carrier delivering the crew member to the fishing vessel, if the crew member boards the fishing vessel at sea.
10.  The provisions to be supplied to the crew, any in-kind payments of a limited proportion of the remuneration, the amount of wages, or the amount of the share and the method of calculating such share if remuneration is to be on a share basis, or the amount of the wage and share and the method of calculating the latter if remuneration is to be on a combined basis, and any agreed minimum wage, and periodicity and form of payments.
11.  The termination of the agreement and the conditions thereof, namely:
a.     if the agreement has been made for a definite period, the date fixed for its expiry, unless agreed by mutual consensus;
b.     if the agreement has been made for a voyage, the port of destination and the time which has to expire after arrival before the crew shall be discharged; and
c.     if the agreement has been made for an indefinite period, the conditions which shall entitle either party to rescind it, as well as the required period of notice for rescission, provided that such period shall not be less for fishing vessel owner and/or operator or other party to the agreement with the crew member.
12.  The right of termination by the crew member in the event of forced or compulsory labour and other mistreatment, and to clearly account for deductions made against the crew member's wages for any in-kind contributions.
13.  The protection that will cover the crew member in the event of forced or compulsory labour and other mistreatment, sickness, injury or death in connection with service.
14.  The amount of paid annual leave or the formula used for calculating leave, where applicable.
15.  The health and social benefits coverage and benefits to be provided to the crew member by the fishing vessel owner and/or operator, or other party or parties to the crew member’s work agreement, as applicable.
16.  The crew member's entitlement to repatriation and terms of repatriation.
17.  Information on crew members’ rights and access to complaint or dispute mechanisms and legal support.
18.  The minimum periods of rest, in accordance with national laws, regulation or other measures.
19.  Full protection of the health and safety and morals of young crew members, including ensuring young crew members have received adequate specific instruction or vocational training and have completed basic pre-sea safety training.

So yeah…, it is great that we have something that is the first one by any RFMO worldwide… and to an extent, we can challenge others at TCC.

It is good to have a stick in the yard to start measuring things… yet I feel that this step is it to help in the legality of their work… while they still make shit money

So yeah… to an extent… the work is just starting. And is good to have the CMM adopted.

My take on future trends for the Purse Seine and Longline fishery in the WPPO by Francisco Blaha

The WCPFC plenary starts today in Suva, and I’m only attending online… since there is little that I can contribute to my role in MIMRA that I have not already done in TCC and SC.

Last week, I caught up with some of my regional friends in Suva as I ended my work with the World Maritime University CAPFISH Summer Academy.

One of the participants asked me about my views on the Purse Seine and Longline fleets' future and logistics after I had been a frontline witness to the fishery in the region for over thirty years. This question made me think…, and I like thinking.

I’m sure others may not share my limited and generally unreferenced view. So, for whatever it's worth, here it is.

Purse Seiners
The number of vessels has decreased as older ones retire and larger, more efficient ones join the fleet. Better technologies and eFADs are making it easier to catch fish, so fewer vessels are needed to find the same amount of fish.

The number will go down slowly for the foreseeable future due to the fishing effort caps among the DWFN and PNA's availability of fishing days.  Based on my perception, we will keep going down and stabilise between 220 and 240.

The graph below, taken from the document just published by SPC and FFA I bloges last, shows the trend in the number of vessels.

I think the value of each day under the VDS has reached the top edge of what is possible and is being paid mainly through heavily subsidising DWFN. Everyone else is out. The way around this is flagging to PICs. While great for catch histories, this comes with potential liabilities as many small administrations can’t act as fully compliant flag states.

If I had the magic wand, I would move toward a short-term and a longer-term goal.

Short term: the value of the vessel day should be tied up to a performance indicator, and the easiest for me is the FFA Compliance Index. Ergo, the value of the VDS should be linked to it… if your vessel is at the worst performing end (-4, -5), you pay 40% (just as an example). If you are -3, then 10% more, if at -2, the base fee, at -1 (10% discount) and at 0 (15% discount). In the case of bilateral fleetwide negotiations, a similar principle applies as an average for the fleet.

Long-term: This is a bit more ambitious and undoubtedly not original… I grew up on a cattle and ship farm. We all knew that if you sold the animals to the truck driver at the farm gate, you made a bit of money. But you would have made more money if you had contracted the transport to take them to the abattoir and sell them to them. And even better, if you subcontract the transport and the abattoir to process your animals and sell them directly to the distributors… then there is big money.

In fisheries, we sell the tuna to the transport truck drivers… the Purse Seiners pays for the right to catch… and that is it. It has the advantage of being easy and practical. Yet, it gives you a limited margin of negotiation and rent maximisation. Is there a model where we subcontract the vessel to catch the fish in our waters, and they take a %, and then get on carriers (that also take %) to the canneries where they process on our behalf (take a %) and we sell to the distributors? Of course, it requires excellent catch monitoring and financial rusting along the value chain… and here, you subcontract one of the big auditing firms and negotiate a % for them of any money they bring to you… They’ll be your bulldogs, and I’m sure the benefit for the region will be more significant than it is now.

I know it sounds utopian, yet in the last thirty years, I’ve seen the power in tuna fisheries shift from the boat owners to those who possess the fish. Of course, the PICs rely on the billions of dollars generated from fishing each year. However, the tuna industry as a whole is built on what it lacks: the PICs’ Tuna. What alternative options do they have? Other oceans stocks are not as healthy, and their volumes are minimal compared to the WCPO.

Longline
The fleet has been losing money for years in the region and has been going down for a while… Past and more recent studies have strongly suggested that longline fleets presently fishing in the Pacific EEZs and in the WCPO are highly subsidised by their flag states.  This is one of the only ways longline fleets have continued operating. I think 1/3 to 1/2 of the fleet only exists because of subsidies (but are maintained under the 1st principle of tuna geopolitics: "If you have a presence, you have rights”). See graph below

When they lose money, the first two things they cut are crew costs (by contracting people from more desperate poor countries) and cutting down maintenance and safety equipment, making the gear even less attractive.

The fleet is now half the size when I left the fishery in 1995. My gut feeling is that it will keep going down until 1500-1600.

The fluctuations in catch from year to year have been on an overall decline over the past 20 years. This coincides with the expansion of the subsidised fleets from DWFNs. The decreasing economic conditions coupled with increasing costs add a further challenge to profitability since

  • Fuel, being a major component, has steadily increased with only short periods of respite from time to time.

  • Prices for premium-grade tuna in Japan have been decreasing, and most exporters have had to redirect it to the U.S. market.

  • USA market returns have increased for premium grade as they recognise the rise in premium grade volume traditionally allocated to the Japanese market. However, this increase is not sufficient to offset the losses from the typically good returns of the Japanese market, which has been struggling since the 1990s and has become uneconomical in the past 5 to 8 years.

  • Compliance costs have significantly increased over the last 20 years

  • Capacity enhancing SUBSIDIES granted to DWFN fleets have competed in the same markets of Domestic fleets, which has also added to a downturn in prices and, in some years, seen gluts in the cannery market price, which has seen returns fall by 35 – 40%.

  • MSC certification has trapped some fleets, with buyers not offering better prices yet demanding certification. At the same time, the costs associated with maintaining it are significantly increasing.

During my fishing days, it was always said that when costs increased, you had to catch more fish by increasing effort, adding more hours to the day, and working harder for longer. Those who succeed will benefit when those who do not fall away.

However, the data and science show that more is needed, as the number of hooks per set has reached a maximum (see below: we are at double the # of soaking hooks than 20 years ago with the same deck technology). Adding more hooks than you can haul within 24 hours reduces catch quality for fish that remain in the water for too long and reduces rest time for crews that must set the line just before sunrise.  

The only option for those in the fishery is to reduce costs, leading to the question: What else can be done? It is worth noting that older vessels are significantly more costly to maintain and experience more downtime than newer vessels. So, breakdowns are a triple whammy: no income due to no fishing, while expenditures continue, and then further expenditure (usually significantly) on the repair.

However, buying a new vessel to improve efficiency does not make economic sense in the current economic climate. Additionally, it is impossible to find a financial institution that will lend money to a money-losing sector in a catch-22 situation.

Investment in new vessels at minimal interest rates to reduce downtime is impossible when no lenders will take the risk. This will only exasperate the effort on the resource, and sooner or later, the subsidies will prevail again.  

Overview of Fisheries and Stock Status of Tuna, Billfish, and Sharks in the WCPO by Francisco Blaha

As usual, the SPC science crew and the FFA economics crew present their “Overview of Tuna Fisheries in the Western and Central Pacific Ocean, including Economic Conditions – 2023 Report” to the WCPFC plenary at this time of year.

This scenario is not too different from last year’s one, with the trend to maintain…. only when you take a “decade view” can you see the more significant picture.

As usual, this made me wonder further about the value of eco-labels… While the four tuna stocks stay in the green, some bycatch is in the doldrums. Remember that principle 2 of MSC concerns ecosystem considerations, including bycatch… I don’t think there is any PS tuna fishery that is not certified in the region, even if five years ago, it was only for “free schools” yet now includes FAD sets… which can negatively impact bycatch.

In any case, it is always a good and transparent read to present the status of the biggest fishery in the world.

The updates for fisheries catch and effort data for 2023 showed no major changes compared to 2022. In terms of the overall catch of tuna, the 2023 catch of approximately 2.62 million metric tonnes (mt) was slightly lower than for 2022. Catches have been similar for the past 4 years, declining by around 10% since the historical peak in 2019. The purse seine (PS) fishery remains the dominant gear, accounting for 70% of the total tuna catch, followed by the combined ‘Other’ category (17%), which includes various gear types and the handline fisheries from Vietnam, Philippines and Indonesia. Skipjack remains the dominant species (approx. 1,636 million mt), accounting for 62% of the total catch, followed by yellowfin 28% (approx. 746,000 mt), bigeye 6% (approx. 146,000 mt) and albacore 4% (96,000 mt), with approximately double the amount of albacore caught south of the equator compared to north of the equator in the WCPFC-CA.

Effort in the purse seine fishery in 2023 was 47,623 days, only slightly higher than 2022. The number of sets has decreased by around 20% since 2010. Purse seine catch in weight is dominated by skipjack, followed by yellowfin, then bigeye, with a negligible catch of albacore. While the total purse catch has been stable over the last four years, the 2023 catch of 1.837 million mt was 13% below the historical peak in 2019.

Effort in the longline fishery in 2023 was 602 million hooks, slightly lower than 2022, and has decreased by around 22% since the historic peak in 2012. The decline in hooks per year is consistent with the decline in catch per year of about 18% since 2010. Longline catch in weight is dominated by yellowfin, then albacore, then bigeye, with a minor skipjack catch. Longline catches in the last two years (228,000 mt in 2023) have increased slightly despite a continued decline in total effort. This increase appears entirely due to increased catches of albacore, primarily south of the equator.

Pole and line effort has continued to decline, although some flattening in the rate of decline is seen in the last decade. Japanese vessels are the largest component of the fleet, followed by domestic Pacific Island vessels.

Based on their most recent assessments (skipjack 2022, bigeye and yellowfin 2023, south Pacific albacore 2024), stocks of all four tuna are estimated to be close to their respective target objectives for biomass depletion and not overfished or undergoing overfishing. The next tuna assessment will be skipjack in 2025.

Southwest Pacific swordfish was assessed in 2021 and was classified as not overfished and not undergoing overfishing. Southwest Pacific striped marlin was assessed in 2024; however, the assessment was not accepted for management advice at SC20. The assessment will undergo more technical work and be presented to SC21 in 2025. Management advice remains as per 2019 that the stock is likely overfished and close to undergoing overfishing.

For the key sharks, the most recent assessment was for silky sharks in the WCPO in 2024, which concluded that the stock was unlikely to be overfished but that stock biomass, while displaying a recovering trend, was uncertain. The conclusion that this stock is now unlikely to be undergoing overfishing is an improvement from the previous assessment that concluded that the stock was likely being overfished. For the other sharks assessed by the SSP, the southwest Pacific blue shark was assessed in 2022 as unlikely overfished and unlikely to be undergoing overfishing, and the southwest Pacific mako shark has uncertain stock status after the inconclusive first assessment attempt in 2021. The Oceanic whitetip shark in the WCPO will be assessed in 2025; based on the 2019 assessment, it remains considered as overfished and subject to overfishing.

The 2023 South Pacific troll albacore catch (1,192 mt) was the second lowest catch level since 1980 (744 mt were reported in 1983), largely owing to a contraction in NZ’s troll fleet operating in the region. The New Zealand troll fleet (94 vessels catching 864 mt in 2023) and the United States troll fleet (10 vessels catching 328 mt in 2023) accounted for all of the 2023 albacore troll catch, although minor contributions also came from the Canadian, the Cook Islands and French Polynesian fleets when their fleets are active in this fishery.

In 2023, market prices for purse seine-caught products increased. Thai imports averaged $1,773/mt, marking an 8% increase from 2022, while Yaizu prices increased by 12% to $1,923/mt.

Conversely, prices for longline-caught yellowfin decreased across all markets. In Yaizu, prices fell by 28% to $5.07/kg. Prices for fresh and frozen yellowfin from selected ports decreased by 17% to $7.33/kg and 26% to $5.60/kg, respectively. The price from Oceania also declined by 5% to $8.51/kg, partly due to the appreciation of the US dollar against the Japanese yen.

Prices for longline-caught bigeye also declined across most markets except Oceania. In Japan, average prices from selected ports for fresh bigeye fell by 7% to $12.29/kg, and frozen bigeye decreased by 25% to $7.11/kg. However, the price for fresh imports from Oceania increased by 8% to $14.11/kg. In the U.S, fresh bigeye import prices rose by 4% to a record high of $12.03/kg in 2022, before slightly declining by 4% to $11.19/kg in 2023. Thai import prices for albacore decreased by 10% to $3.19/kg in 2023. Similarly, US fresh prices declined by 5% to $5.63/kg, and Japanese selected ports fresh prices fell by 20% to $3.24/kg.

In 2023, the total estimated delivered value of the tuna catch in the WCPFC-CA increased marginally by 4% to $6.1 billion. The purse seine fishery, valued at $3.5 billion, saw a 7% rise from 2022, representing 56% of the total value. In contrast, the longline fishery’s value decreased slightly by 1% to $1.6 billion, while the pole and line catch value dropped by 11% to $312 million, attributed to reduced catches and a decline in the Yaizu price for pole-and-line-caught skipjack. Conversely, the value of catches from other gears increased by 11%, reaching $820 million.

In 2023, the WCPFC-CA skipjack catch was valued at $3 billion, a marginal 2% increase from the previous year, and accounted for nearly half of the total tuna catch value. The value of the albacore tuna catch decreased by 9% to $304 million, while the values for yellowfin and bigeye catches increased to $2.1 billion (+10%) and $784 million (+4%), respectively.

In 2023, economic conditions across purse seine, tropical longline, and southern longline fisheries in the WCPFC-CA improved compared with 2022. The tropical purse seine index improved, remaining above average at 109, driven by rising fish prices and declining fuel costs. From 2018 to 2020, this index stayed considerably above its 20-year average, primarily due to high catch rates. In 2022, the index dropped to 98, its lowest level since 2014. However, it rebounded in 2023, driven by an increase in fish prices, declining fuel costs and higher catch rates.

For the southern longline fishery, 2023 saw a positive trend, with the index approaching its 20-year average, supported by higher catch rates and lower fuel prices. Similarly, the economic conditions for the tropical longline fishery improved, nearing the 20-year average, driven by increased catch rates and decreased fuel prices.

The Summer Academy of the CAPFISH project by Francisco Blaha

The past few weeks have been intense for me while working on the PSM side in Tuvalu. Since Sunday, I have participated in a series of lectures at the summer academy of the CAPFISH project, organised by the World Maritime University (a UN University) and supported by the Korea Maritime Institute here in Suva, Fiji.

 Education is one of the most powerful tools for empowering people, changing attitudes, and solving complex problems. Illegal, Unreported, and Unregulated (IUU) fishing presents a multifaceted international governance and sustainability challenge that must be addressed from various specialist angles.

 Solving this problem in the real world requires coordination, a holistic understanding of the issue, and the dissemination of knowledge to developing country actors who need it most and can effect change in their communities and institutions.

 Through a series of educational workshops, the CAPFISH Project shares the expertise of UN specialized agencies. It imparts both academic and practical knowledge to maritime professionals from across the developing world. CAPFISH is a transdisciplinary initiative integrating science, economics, marine policy, ocean governance, law and regulation, maritime technology and operations, safety at sea, societal factors, human rights, and compliance monitoring and enforcement.

 CAPFISH aligns with SDG 17 (Partnerships for the Goals) and SDG 4 (Quality Education) to tackle the challenges posed by IUU fishing, which affects the achievement of SDG 14 (Life Below Water) and SDG 8 (Decent Work and Economic Growth).

 My role has involved being a regional facilitator, providing thematic and expert suggestions for the lectures, as well as teaching various topics that I have engaged with over the last few years, including:

  1. - Quantification of IUU Fishing in the Pacific Islands Region and the Adjacent High Seas

  2. - Official and Private Certifications in Fisheries in the WCPO

  3. - Human Rights at Sea: A Fisher’s Perspective

  4. - Examples of Cooperation on IUU Fishing: the FFA PSM Framework and the ePSM Tool

  5. - The Challenges Surrounding a Regional CDS as a Compliance and Trade Tool.

It is an absolute honour to be entrusted with supporting the team at the World Maritime University and collaborating as a lecturer in the various areas of my work.

The academy lasts two weeks at the beautiful Novotel in Lami, near Suva. Additionally, this will be my last travel job for the year.

The passing of Hugh Walton by Francisco Blaha

The big thing about fishing is that it has its own culture and its own universe. It’s very difficult to describe, but it is one of the things that still works in deep human relationships. I always say that fisheries are about people more than fish… and as the cliche goes… there is no coincidence that the word “ship” is used in friendship.

Fisheries seem to attract a lot of characters… (I included myself in that)… and in the Pacific, there are quite a bunch… As I’m sitting in a meeting room in Busan in South Korea, at the FAO PSMA working group, the sad yet not unexpected news of the death of Hugh Walton, a friend and mentor, makes this sunny day a bit gloomier.

I have always been very thankful to him; he gave me the only thing I could not get by myself as an immigrant: “an opportunity."

Hugh’s favourite poem. Sam Hunt's "Beware the Man" as painted by Dick Frizzell. Source

The Greeks have this concept of a protector, Agyieus, like an older brother; because I didn’t have references for this life as a consultant, I had chosen in the Pacific, he was one of those references for me.

We both come from fishing boat backgrounds, which formed the basis of our friendship and views… Sometimes, I would come up with ideas that were not standard in our line of work, and he would say, "Yeah, we should try that; we will do that… The usual hasn't worked so far.”

He believed in people. I am one of his exponents. I have grown up with not many principles, but there indeed are two I uphold: I profoundly dislike ungratefulness and pretentiousness. Hugh was neither of those.

My family also grew fond of him, and a book for “uncle Hugh” was part of our Christmas shopping for almost two decades.

He had a very colourful life and worked tirelessly for all the big fisheries organisations in the region, including USP, SPC, and FFA. I doubt there are any Pacific island fisheries leaders who weren’t trained or helped by him over the last four decades.

I started working close to him in Kavieng, Papua New Guinea, where he fostered and was in charge of the Fishing College for many years. There, I realised that fisheries weren’t just a job but his life. There was little tradition of commercial fishing in PNG; the industry had to be built from scratch. What we have in the Pacific now is much more than before. He also instigated the mariculture research facility supported by a small resort.

I think some of his most outstanding achievements would definitely be the Fisheries College in PNG and the Observer Standards for the entire fishing fleet. All the Observers in the Pacific are based on the standards that he initiated and worked on; he set up the structure to evaluate the quantification of IUU fishing that will be done every five years now. He was in charge of the project to negotiate access to the EU.

A few years ago, the EU named and shamed the Pacific Island fishing countries. We had to mobilise, and he asked me to help with this. We managed to get the card system removed, an example that was followed globally because of Hugh’s vision, working with FFA’s support.

Hugh’s work brought labour condition requirements to the forefront. We were the first region in the world with standards where the fishermen are covered by their conditions of employment.

A few years ago, the FFA, where Hugh worked, also received world recognition as the most advanced organisation in preventing IUU fishing. He was the mentor at the centre of that.

He also trusted me with many jobs, yet there are three jobs I’m particularly proud of, which I wrote about in the past: the plastics assessment, the IUU quantification, and the last transhipment impracticability study.

In any case, I could write for days about his work. With him, we believed it was our job, to get ourselves out of a job, because we do capacity building.

As a human, he was far from perfect, yet he was the 1st one to recognise that… being  a hard drinker and a long-term smoker shortened his life… yet he lived on his own terms.

In his late biography, I was honoured when he asked me to write the foreword and the last paragraph of the book; something he wrote is hitting me deeply at the moment.

"A line from Sam Hunt that I have always liked, a lovely line, evocative of a number of things,

Beware the man that tries to fit you out in his idea of a hat.

Yes, as my friend Francisco has said I have tended not to follow a path in life, I have made my own, I have just been bloody incredibly lucky, these evolving experiences, so much about the upbringing I have had, taking my opportunities following my heart, and my wonderful whanau.” 

 Moe mai ra Uncle Hugh

Completing and Approving "Deep Dive 3", ISA's most advanced training by Francisco Blaha

Done! I went over 50 lessons, each with its exam, plus a general module exam required to access the next module. A minimum of 80% was needed to pass each exam.

I enjoyed the Deep Dive 3 learning opportunity. It wasn’t easy, and I had to dive deep (pun intended) into my background knowledge of UNLOS, Chemical, Physical, Geological, and Biological Oceanography, Environmental Assessment Best Practices, and the staggering engineering challenges associated with evaluating, prospecting, and potentially mining in the “Area” (The international seabed area – under ISA jurisdiction – is the seabed and ocean floor and the subsoil thereof, beyond the limits of national jurisdiction. It represents around 50% of the total area of the world’s oceans)

I aimed to have the best and most direct information for an educated opinion on this challenging, controversial, yet helpful topic for humanity as a whole.

The reality is that 'if it can't be grown, it must be mined.’ It is impossible to argue with that. The rest is where we draw the compromises.

Thanks to the International Seabed Authority for setting up this unique and transparent opportunity that I hope will help me further my career on compliance issues in the marine realm.

The volatility of container trade pricing and what it means for tuna containarisation by Francisco Blaha

I have been dealing with containerisation vs. carriers in the tuna industry for a while now. The number of times over the last two decades that I have heard carriers are out (mostly from consultants and bureaucrats) … feels bigger than the number of containers exported with tuna from the region.

too many variables and preconditions…

In fact, I wrote a couple of reports for FFA and then FAO about this, as well as many blogs about the separation of containerisation (which implies landing) from Transhipment.

In a nutshell, I firmly believe that containerisation in the Pacific will always be, at best, a minor complementary activity to transhipment.

This is not because of any particular issue surrounding the activities and/or actions of the Pacific island administrations themselves… but mainly because of economies of scale, geographic isolation, and the monstrous investments necessary to develop, build, upgrade, and maintain capable ports able to handle container vessels.

And if that wasn’t enough, the fishing effort epicenters are behaving erratically due ti the intrinsic variability of climate change, and then you need to add the massive volatility in the container transport costs

The FFA TRADE AND INDUSTRY NEWS, a publication I find to be an excellent and somewhat undervalued resource, recently featured an article that delves into the challenges of container freight charges in the seafood import industry.

More and more of what is called “black swans,” either coming from climate change and/or geopolitics, will be intertwined with the container trade, and fishermen are very fiscally conservative, so they will not put all their eggs in one basket. As long as tuna is still processed in Thailand, Vietnam, and Ecuador, Carriers will continue to reign, as they are a much more solid and price-stable platform that only needs a lagoon to anchor….

I quote it below… but read the whole newsletter

EU and US seafood importers suffer from soaring container freight charges

In May 2024, US President Joe Biden announced steep tariff increases would be introduced on a range of products imported from China, including electric vehicles, batteries, semi-conductors and solar cells, effective 1 August.

This drove a rush of exports of these products from China to beat the 1 August deadline, resulting in a shortage of containers and subsequently, a steep increase in freight charges. At the beginning of the year, freight rates for 40-foot freezer containers from Asia to Europe were around USD 2,500-3,000.

By July, rates had reportedly more than doubled or tripled reaching above USD 9,000. In addition, many Asian-based exporters struggled to secure bookings for containers on ships, typically experiencing delays of up to 4-6 weeks. This marks the third event post-COVID to negatively impact freight rates and shipping times.

In early 2023, Panama suffered a severe drought with Gatún Lake, which supplies water to operate Panama Canal’s Atlantic and Pacific locks, experiencing historically low water levels. This resulted in a restriction being placed on vessel traffic passing through Panama Canal from typically 36 crossings to 24 crossings per day in November 2023 (over 30% reduction).

Fewer booking slots available via the Panama Canal resulted in shipping delays, with vessels queuing much longer to transit the canal. According to industry sources, reefer carriers and container ships servicing the tuna industry experienced delays of at least 10 days waiting to pass through Panama Canal.

Ships moving between Asia and Europe via the Suez Canal must pass through the narrow Bab el-Mandeb Strait that borders the Yemeni Coast, connecting the Red Sea to the Gulf of Aden. In November 2023, around the same time Panama Canal transits became more restricted, Yemen-based Houthi militia commenced attacking merchant ships in the Red Sea.  Some vessels have opted to avoid the Suez Canal and take the longer and hence, more costly route around Southern Africa, which according to industry sources adds an additional 7-10 days’ transit time.  

Delays at the Panama Canal, disruptions to the Red Sea shipping route and now, changes in US tariff rates for China have created a triple-squeeze on global shipping capacity and thus bumped up freight prices. Longer routes put upward pressure on freight rates because of fuel costs.

Also longer voyages require more ships to maintain the same delivery schedule, resulting in fewer available ships to carry products. Ships continuing to route through the Red Sea are also subject to higher risk insurance premiums. In turn, high freight costs places pressure on both seafood exporters and importers, and ultimately, results in higher retail prices when these costs are passed onto consumers.

While the Red Sea issue remains, following increased rainfall and restoration of water levels in Gatún Lake, the Panama Canal Authority announced a return to 35 booking slots for early August 2024. The Biden Administration has also delayed an announcement on final determinations regarding the planned tariff hikes for Chinese goods which were due to come into effect on 1 August.

Pending no further major disruptions, shipping rates are expected to return to more reasonable levels (USD 3,000-3,500), assisted largely by more capacity being added to the global container ship fleet due to new builds.

Raising awareness of climate change by learning its language by Francisco Blaha

 I'm always stoked when Pacific Community-SPC chooses one of my pictures to cover any of their publications. My favourite is the Fisheries Bulletin and the latest edition includes a piece I co-wrote with Steven Hare, "Raising awareness of climate change by learning its language perspectives from a participant and an organiser".

This article concerns the Pacific Climate Awareness Pacific Climate Awareness Workshop (CLAW) (CLAW), I have been blogging about recently. Steven, who was one of the key organizers, approached me to write something. I didn’t see any point in being technical about it, but I decided to dive into the more “philosophical” aspect of it and dwell on how I felt about learning and/or conforming to what I know about the impact of climate change in fisheries.

It may not be the usual technical approach to my writing, but I think climate change is a human tragedy, not just a human-driven event…

 In any case, here is the full article, and below my contribution

As a participant in many meetings, it would be an understatement to say it was one of the most sobering (and sometimes soul-crushing) workshops I have attended.

The workshop’s premise is very sound: climate change impacts, sea level rise, and temperature are affecting Pacific islands in terms of their existence in the long-term, and economic viability in the medium-term, as climate change affects tuna distribution and abundance.

Much has been discussed over a long time so far. Yet, we are facing an increasing scope of research from climate science that needs to come into fisheries science. This sometimes uses similar terminology with different meanings, which is already confusing for Anglophones and even more so for those who have English as their second, third, or fourth language, as is the case for most people in the Pacific. Hence, this workshop responded to the need to standardise language and concepts while providing the latest information and research on climate change, fisheries, and their interactions, and it did a splendid job at that.

In 1949, the environmental philosopher Aldo Leopold wrote: ”One of the penalties of an ecological education is that one lives alone in a world of wounds.” He wasn’t referring to climate change at the time but rather to the importance of preserving natural ecosystems and our ethical responsibility to care for them. If nature does not flourish, neither will we, seems to have been his message … that obviously hasn’t been heard.

Most of my work is operational, centred on increasing reporting accuracy, diminishing the impacts of illegal, unreported and unregulated (IUU) fishing, and expanding the understanding of fishing fleet logistics and dynamics. These efforts all contribute to the bigger picture of better fisheries management. However, many people scorn those who do this type of work for not being good enough or fast enough, for being political and industry puppets, and so on.

Most of the criticism comes from well-intentioned folks who are very fast at pointing fingers. Still, they may not know how technical the issues can get, mainly when adding other elements around subsidies, social responsibility, and the economic vulnerability of the nations that own the fish against the distant water fishing nations (DWFN) that catch most of the fish.

Yet, people keep pointing fingers at these issues while seemingly forgetting that climate change is a topic we all need to have a much more significant interest in and impact on.

The key learning from the four days is the scope of climate change in fisheries and how overwhelming it is in all aspects … from the growth of individual fish to the macro-oceanic patterns, from variations in seawater chemistry to the literal survival of coastal nations, from adjusting the stock assessment models to pan-Pacific fisheries management.

While we should continue focusing on the operational aspects, we urgently need to address these “new” and ongoing climate change-related variabilities and issues. We need to start thinking outside the box and develop new approaches that look at all the aspects, identify weak points, and try to respond to them. We also need to evaluate what happens within the intermediate periods, which has not been tested, as we tend to focus only on extreme scenarios.

Yet, in comparison, whatever we do right or wrong in fisheries has very little impact on its future if we don’t reduce emissions as a starting point.

A question I often ask myself when thinking about this is how to stay productive in the face of climate change. Pessimism (throwing my hands in the air and saying, “we are doomed!”) is paralysing, and so, for that matter, can optimism (why worry when it will all be okay in the end?). How, then, should I think and act around this?

I personally try to adhere to the philosophical perspective of “meliorism” which is defined as the “doctrine that the world, or society, may be improved and suffering alleviated through rightly directed human effort”, and comes from the Latin “melior”, meaning “better”.

So, rather than wallowing in “a world of wounds,” the “meliorist” in me, likes to believe in the potential for gradual, incremental improvements through human effort. Even if reality and the actions (or, better said, inactions) of most governments today are discouraging, what other options do I have?

A phrase by the public intellectual Noam Chomsky has guided me over the years: “We have two choices: ‘to abandon hope and ensure that the worst will happen’ or ‘to make use of the opportunities that exist and contribute to a better world’. It is not a very difficult choice.”

The climate change studies, and the gloomy figures presented in CLAW can be discouraging. Yet, they need to be interpreted positively: Reducing warming by any amount will move us up the scale and produce a lesser impact on fisheries, so people like me can work better on fisheries monitoring, IUU, etc., and ultimately contribute to better fisheries management.


A framework to evaluate the impracticability exemption of high-seas transhipment in the WCPO by Francisco Blaha

 Over the years, I wrote extensively about the abuse of the impracticability exemption on high-seas transhipment by longliners in the WCPFC. High Seas Transhipment is to be an exception, yet it seems to have become a norm; in 2023, there were 914 high seas transhipment events reported to the Commission, with 62% of vessels on the Record of Fishing Vessels (RFV) authorised for this activity as can be seen in the Annual Report on Transhipment Reporting.

Transhipment events in the high seas areas of the WCPFC convention area between 20˚ N and S of the equator. Transhipment ports are shown as grey dots with city, country labels

Furthermore, this issue is not only of personal interest but also one the Marshall Islands has been very vocal about, presenting an excellent paper on the legal side of it back in 2018 at TCC14. And if that wasn’t enough, HS TS reporting is the main issue we face in terms of IUU, as found in the quantification reports I have been involved with for FFA.

So, as part of our work in partnership with Starboard.nz, we decided to tackle this from an operational perspective to support the work of the WCPFC Transhipment Intersessional Working Group on strengthening the policies and regulations associated with high-seas transhipment in the western central Pacific. The work was funded by FFA's Pacific–European Union Marine Partnership Programme (PEUMP).

The main argument used by the DWFN involved in HS TS is a potential economic burden of in-port transhipment is the extra distance a fishing vessel travels to get to a suitable port instead of transhipping at sea. We test the hypothesis that transhipment at the port is economically not unreasonable. This hypothesis is based on the fact that there are currently 23 ports in the area with infrastructure for transhipment and supplying fishing boats and that the purse seine fleet demonstrates economic viability by transhipping in port while also operating on the high seas.

Illustration of the journey metrics for an example transhipment event

We investigated in detail the transhipment activity in the WCPFC high seas areas using ship tracks and vessel details to address the following specific questions:

  • What is the spatial distribution of high-seas transhipment activity in the WCPFC?

  • What characteristic travelling patterns can inform the argument's validity of economic hardship?

  • Who are the central carrier vessels involved in the high-seas transhipments?

  • Who are the fishing vessels transhipping with the central carriers?

Based on the findings and learnings from our investigation of transhipment activity, we propose a framework to evaluate claims of potential economic hardship of in-port transhipments based on vessel tracks and their comparative proximity between transhipment ports and at-sea transhipment locations.

The WCPFC TCC 20 website has the full report and a summary report for those who want to read less.

Below is the executive summary, but I recommend you read the full report and the operational annexes, which strengthen the call for an actual framework for this problem and/or an independent Regional Observer Program for the region.

I’m pretty proud of the results of this work, not only because of its results but also because it fosters collaboration between a fisheries administration and a trusted technology and information provider, with the funding of regional organisations and the EU as partners.

The entire network of our dataset of transhipments. Blue vessels are on the FFA’s good standing list. The eight central carrier vessels are identified by name in dark grey boxes. Other carriers mentioned in the text are named in light grey boxes. An interactive HTML file that allows exploration of all vessel names, flags and transhipment numbers is provided in the Attachment: transhipment_network.html.

Executive summary

The WCPFC and the WCPF Convention aim to restrict transhipment at sea. The Conservation and Management Measure (CMM) 2009–06 specifies that longliners and other vessels are not allowed to tranship on the high seas unless "it is impracticable for certain vessels… to operate without being able to tranship on the high seas”. Accordingly, WCPFC Members are mandated by CMM 2009–06 to determine if in-port transhipment is impracticable for their relevant vessels and to submit a plan describing the measures being taken to promote transhipment in port.

To establish when transhipment in port is impracticable, the WCPFC has developed a two-part test. First, there must be "significant economic hardship" due to the restriction on high seas transhipment. Second, the ship must alter its historical method of operation in a "significant and substantial" way to comply with the prohibition on transhipment over the high seas. Despite these regulations, CCMs are failing to carry out their responsibilities, and transhipments on the high seas for vessels other than purse seiners have been the norm.

This study was conceived and conducted by the Marshall Islands Marine Resources Authority (MIMRA) and Starboard Maritime Intelligence to support the work of the WCPFC Transhipment Intersessional Working Group on strengthening the policies and regulations associated with high- seas transhipment in the western central Pacific. The work was funded by FFA's Pacific–European Union Marine Partnership Programme (PEUMP).

This study investigates the economic implications of transhipment activity in the WCPFC high seas areas using analysis of vessel tracks reported via the automated identification system (AIS). Based on FFA analysis, we assume that the critical component for economic hardship is based on the cost of fuel, and that fuel consumption is directly correlated to distances travelled. Arguments based on historical operational practices are more complex to scrutinise as they require a largely qualitative analysis of activity records over many years, and we recommend their investigation for future work.

We found 4,666 potential transhipments between carrier and fishing vessels between May 1, 2020 and November 4, 2023 in the WCPFC high seas regions within 20˚ of the equator. Of these, 1,048 lasted longer than five hours and formed the basis of this analysis. They involved 375 longliners and 27 carrier vessels. The fishing and carrier vessels were flagged to Panama, South Korea, China, Taiwan, Japan, and Vanuatu. Our network analysis suggests the existence of distinct relationships between fishing and carrier vessels, with more connections between carriers from the same flag states than between differing flag states. In particular, eight carrier vessels are involved in 73% of all transhipments in our dataset and can, therefore, be considered central to the Western Central Pacific Ocean activity.

Targeted analysis of 50 transhipment events resulted in a generalisation of fishing vessel behaviour into three characteristic journey patterns:

  1. Fishing in EEZs of a WCPFC member state, then transhipping on the high seas;

  2. Fishing exclusively, or predominantly, on the high seas, but transiting across member states’ EEZs and passing suitable ports; and

  3. Fishing in remote high seas areas, rarely entering EEZs, and transhipping with passing carrier vessels.

We argue that the impracticability exemption was initially conceived to support vessels historically operating according to the third journey pattern. Our finding of numerous events fitting patterns one and two indicate questionable application of the impracticability exemption for in-port transhipment.

We developed metrics that can be assessed procedurally using computer code to derive general patterns from this dataset that potential policy changes may address. These metrics allow for comparing a vessel's distance to reach the high-seas transhipment location with the shortest distance to a suitable transhipment port. The automated calculation of distances related to fishing and transhipment activities provides several insights that would be hard to gain using manual inspection:

  • High-seas transhipments involving vessels that fished in relative proximity to ports in PNG (Rabaul, Port Moresby and Kavieng), the Solomon Islands (Noro), and Tonga (Nukualofa) often travel excessively for transhipment.

  • Eleven carrier vessels, including three central carriers, often received fish that could have been offloaded in port with less or equal travel-related expenditure.

  • 27 longliner vessels made multiple journeys that were more than twice as expensive to reach a carrier vessel on the high seas compared to travelling from the central fishing area to a transhipment port.

The approach we developed in this work to contribute to assessing the economic implications of transhipment can be applied in practice to individual vessels with a high-seas transhipment event. We present step-by-step instructions for practitioners to determine the distance metrics and recommend that this proposed method be applied by WCPFC member states and evaluated for suitability.

We present this approach as a proof of concept for developing a framework to evaluate the impracticability of high-seas transhipments. We fully expect that feedback based on practitioners' experience and discussions with experts and stakeholders will result in modifications and refinements of the method and interpretation of results.

In summary, our findings suggest repeated port avoidance by many vessels licensed to fish in the waters of some FFA members. This suggests that decisions to favour high-seas transhipment over port calls are made for groups of vessels. If true, this practice would be against the transhipment CMM (CMM 2009–06). This challenges any notion that the WCPFC CCM involved in high-seas transhipment carry out the expected due diligence as mandated by CMM 2009–06 to determine if in-port transhipment is impracticable for a particular vessel.

We note that oversight of high-seas transhipments is addressed in the Indian Ocean Tuna Commission (IOTC), International Convention for the Conservation of Atlantic Tunas (ICCAT), Inter- American Tropical Tuna Commission (IATTC) and to a certain extent, the Secretariat of the Commission for the Conservation of Southern Bluefin Tuna (CCSBT) with independent regional observer programmes. As such, it is recommended that if vessels choose to fish in areas of the high seas that justify the impracticability exemption in terms of economic hardship and historical method of operation, they should operate under an observer programme similar to those their vessels comply with in all other tuna RFMOs or come to tranship at any port in the region.

We recommend that the TS IWG considers our findings in its measure review and recommends further revisions to the transhipment CMM to WCPFC21, addressing the issues discussed here.

Errors and bias in marine conservation and fisheries literature by Francisco Blaha

Fisheries is a complex world, mainly when it becomes multijurisdictional; it is at the crossroads of public policy, industry, food security, geopolitics, and even recreational activities. Yet, unlike other forms of food production, it is heavily anchored (pun intended) on science.

And I’m not arguing here that fisheries do not have problems…. These blogs have pointed out their problems for the past ten years and suggested a few solutions. Good science and fact-based management are fundamental to any hope of fixing or preventing problems from worsening.

However, it's important to remember that science is a human activity, and like all human activities, it is susceptible to errors and potential misuse for personal gain/fame or to push a particular agenda.

I have pointed out peer-reviewed papers that praise the MSC private eco-label, almost all of whose authors are employees of that eco-label. So yeah, it's surely legal to do that… but I'm unsure if it's ethical.

There have also been papers that gained notoriety for catastrophising fisheries or criminalising fishermen, and the press, in the “doom sells” principle, runs with the headlines. The slow process of corrections starts, yet those NEVER get the same attention.

This recent paper by a group of heavyweight scientists involved in debunking these erroneous papers made one out of that process… now can you argue that they are doing it for personal gain or pursuing an agenda? Well, let’s see if this paper gets the same headlines all the others got…

I doubt it. As said, “doom sells… but not helps”

In any case, the paper is Errors and bias in marine conservation and fisheries literature: Their impact on policies and perceptions and as usual, I recommend you read the original (and thanks to Matias B for sharing it)

I quote the parts that resonated the most with me below

ABSTRACT
Sound and effective policies, informed by reliable science, are needed to ensure the sustainable well-being of oceans and marine resources. Scientific publications often influence evolving policies and inform the public, but sometimes contain errors. The prevalence of papers conveying unjustified messages and with the potential to influence public perceptions and policies is concerning. This paper focuses on marine examples that have led to exaggeration of negative impacts on ecosystems, particularly from fisheries, but the criticisms and recommendations also apply more generally. Examples are given of papers on high profile topics that used flawed assumptions or methods, leading to some misleading findings. All examples were eventually followed by published rebuttals. Such papers, often accompanied by media campaigns, can lead to inappropriate policy choices, and other negative outcomes. Science is eventually self-correcting but often too slowly to prevent flawed perceptions and policies. Problems should be corrected before publication. A common weakness in the publication process is inadequate peer-review. Shortcomings at the level of editor can also contribute to the failures. Pressure on scientists to publish, leading to increasing numbers of papers, puts reviewers under more pressure and makes it harder for editors to find suitable ones.

Recommendations to avoid the impact of flawed science on policies are made within the framework of a three-legged stool consisting of:

(1) scientists who strive for objectivity and accuracy;
(2) journals with editors and referees better equipped to guard against unreliable scientific publications; and
(3) transparent and inclusive scientific processes to formulate advice on policies and their implementation.

Incidence of erroneous and potentially misleading publications in the primary literature

2.1. Examples
It would be near impossible to estimate the incidence of substantial errors in peer-reviewed publications. Instead, in this section we illustrate the nature and potential impacts of the problem by presenting some examples of papers with flawed assumptions and methods, erroneous results, and misleading findings (Table 1).

We have used the following criteria in selecting these examples:

  • They address key issues in fisheries and fisheries management that are relevant to policy and management;

  • All have been subjected to peer reviewed rebuttals (often in the same primary publication as the flawed paper), which have criticized them for including misleading results and conclusions; and

  • They have achieved high profiles, sometimes aided by media campaigns.

 These examples are likely to have fueled misperceptions on topical issues across a wide audience. They may therefore have contributed to, or have the potential to contribute to, poor policy decisions and actions leading to costly and inappropriate management of fisheries and marine conservation, foregone sustainable benefits, and other negative outcomes.

The criticisms highlighted here are based on the published rebuttals and take account of published responses by the authors of the examples to those rebuttals.

The use of marine protected areas (MPAs) for fisheries management is a contentious policy issue addressed by several papers of concern. Whereas MPAs are important for biodiversity conservation [70–72], a problem with some publications advocating more applications of MPAs as a fishery management tool is that they have been misleading in terms of the benefits and costs of MPAs on fisheries yield. For example, White et al. [73] concluded that MPAs can achieve “….higher profit than attainable under conventional management”, but Hart and Sissenwine [74] questioned some of the assumptions in the paper and pointed out that it potentially misleads the reader by reporting yield in numbers of fish rather than weight or volume as is customary, thereby ignoring the reality that larger fish of a species are usually more valuable than smaller fish.

Three more recent contentious MPA papers are included as examples of problematic scientific papers (Table S1). The first, Cabral et al. [21], estimated that increasing the current global network of no-take MPAs would allow future catches to increase by at least 12 %. Various assumptions made in the paper were challenged by Hilborn [23] and Ovando et al. [24]. Almost a year after publication, the article was retracted when it was shown that the article’s editor had a conflict of interest as a frequent collaborator with several of the authors and that the paper had overestimated the benefits of the MPAs [22].

Sala et al. [25], using the same model as [21], reported that a considerable increase in the protected areas of the oceans would have substantial benefits for biodiversity conservation and carbon storage, and result in improved yields from fisheries. However, Hilborn and Kaiser [29] and Ovando et al. [31] pointed out several flaws in the as- sumptions and analyses, while Hiddink et al. [30] reported that the authors had over-estimated the impacts of trawling on the release of CO2 by several orders of magnitude. The authors of Sala et al. [25] discuss these criticisms of their study and challenge several of them in their responses [26–28] but, importantly, acknowledge the need for further research and analyses to assess the implications of some of the key assumptions of their model for the results and conclusions obtained.

Medoff et al. [32] reported that the establishment in 2016 of the world’s biggest fully protected MPA, in waters around Hawaii, had led to a gradient in CPUE for two species of tuna near the boundary of the reserve. The authors concluded that large MPAs protect migratory fish species and benefit their fisheries. Hilborn and Hampton [33] pointed out that the analyses did not consider the very low catch of tuna species in the area before the MPA was created and that the authors had also failed to take into account the assessed increase of yellowfin tuna in the West Pacific that had started two years before the MPA was created. In addition, Hampton et al. [34] investigated the change in abundance of tunas after the establishment of the Phoenix Islands Protected Area, where fishing pressure had been much higher than around Hawaii, and concluded that large protected areas for tunas and other highly migratory fishes were unlikely to increase abundance or benefit fisheries.

In examples on the status of fish stocks, Myers and Worm [15] claimed that the biomass of many large predatory fish had been reduced to about 10 % of their pre-industrial levels, with potentially serious consequences for ecosystems. Walters [42], Hampton et al. [41] and Polacheck [14] contested those findings, reporting that the extent of depletion had been exaggerated through the use of CPUE exclusively, while ignoring other indices and alternative interpretations of early CPUE declines. On the same theme, Baum et al. [43] and Baum and Myers [44] described what they considered to be the collapse and possible extirpation of shark populations in the northwest Atlantic Ocean and Gulf of Mexico. Both papers were criticized by Burgess et al. [46], who argued that the extent of decline had been overstated through the use of limited and inadequate data sets as well as disregard by the authors of other data sets and assessment results.

Worm et al. [35] projected a global collapse of all taxa then being fished by 2048. There is evidence that the suggestion of a collapse by 2048 was included in the primary publication to obtain popular media attention [17]; their projection has been frequently quoted in both the academic and popular media. Several fisheries scientists challenged that result (Supplementary Information), including Branch [38] who pointed out a number of methodological problems with the paper. A working group representing the various different perspectives reconsidered the global status of fisheries using actual stock assessment results and concluded instead that a mixture of sustainably harvested and over-exploited stocks would eventuate [75]. The original paper, with the incorrect forecast of collapse, had been cited 5712 times as of 27 July 2023 while Worm et al. [75], with the revised analyses, had only been cited less than half as many times (citations from Google Scholar).

Pauly et al. [47] suggested that the mean trophic level of catch could be used as an index of ecosystem health and that the mean trophic level of the global catch had declined. This result has been widely promulgated by various NGOs. However, this paper's findings have been criticized for various methodological problems, including underlying assumptions and failing to take increasing catches of lower trophic level fish into account.

Also on the theme of ecosystem impacts, the authors of Gremmillet [51] on interactions between seabirds and fisheries in South Africa were required to submit an Erratum [52] after being criticised for several incorrect and potentially damaging statements on the management and social and economic features of the fishery [53]. Another example of seabird-fishery interactions is Sherley et al. [55], which reported positive effects on penguin reproductive success of experimental closures to pelagic fishing in the neighbourhoods of penguin breeding islands. However, Butterworth [76,77] reported that the method used did not adequately account for pseudo-replication in the data and thereby overestimated the precision of the results. The same methods were subsequently used by Sydeman et al. [56] to argue for continuation of island closures. Both papers were challenged in a rebuttal of the Sydeman et al. paper by Butterworth and Ross-Gillespie [59]. Final resolution of the methods and results came after a panel of six qualified international scientists appointed by the South African Government conducted an intensive on-site review and confirmed that additional analyses were needed to address the pseudo-replication problem [60]. The Panel concluded further that the impacts of fishing closures around the breeding islands were likely to be small compared to the rate of decline of the penguin population, and that additional research was necessary to determine the factors driving the greater part of the decline.

Another well-publicised example is the paper by Kroodsma et al. [62] claiming that fishing activity covered at least 55 % of the world’s oceans, four times the land area covered by agriculture. However, Amoroso et al. [64] pointed out that the coarse spatial scale of the analysis had led to the original paper overestimating the footprints of all fishing and trawling by factors of >10 and >5 respectively.

In one of a series of contentious papers, Munday et al. [65] reported findings that future ocean acidification could seriously disrupt the ability of clownfish larvae to differentiate between cues used in locating suitable sites for settlement. In another paper, Dixsonet al. [66] reported that juvenile corals and fish are attracted by cues from non-fished areas dominated by corals but are repelled by cues from reefs that are fished and dominated by seaweeds. Doubt was raised about the validity of those results by Clark et al. [67] and in other papers, which reported contrasting results, and that the sizes of the effects that had been reported in those studies were highly unlikely. Munday and Dixson et al. [68] challenged the Clark et al. paper but Dixson et al. [66] was retracted by Science in 2022. There are ongoing concerns about a number of the papers in this suite [78].

Each of the examples presented here is unique, and the criticisms raised in rebuttals differ from paper to paper. Nevertheless, they all exhibited the common problem of weaknesses in assumptions, for example the assumption in Cabral et al. [21] and Sala et al. [25] that for some key species in their analyses, the whole global range of the species was connected through larval and adult dispersal [23]. In Worm et al. [35], the definition of a fisheries collapse and the assumption that catch is a proxy for abundance were primary criticisms, in addition to their erroneous projections of estimated trends [38]. Methodological problems in these examples included: inappropriate treatment of spatial structure or dynamics (e.g. Cabral et al. [21], Sala et al. [25], Kroodsma et al. [62]); inconsistent accounting of fishing effort across the different outcomes analyzed (Sala et al. [25]); inadequate interpretation of CPUE information (Myers and Worm [15]); and use of limited and inadequate data sets (Baum et al. [43], Baum and Myers [44]). In Sherley et al. [55], errors in the statistical analyses were identified as a problem [59,60], while in Gremillet et al. [51]], incorrect statements and lack of understanding created a negatively biased impression of aspects of the local small pelagics fishery and its management [52,53].

Impacts of erroneous and potentially misleading papers
For fisheries to be able to make their potential contributions to food security, nutrition and livelihoods in a sustainable way, it is critical to understand what management methods have worked in different ecological, social and economic circumstances and what methods should best be used where improvements are most required [7]. Similarly, reliable information is required on the true impacts of fisheries on en- environments and ecosystems at a resolution enabling effective decisions that provide adequate protection without unnecessary impacts on livelihoods and other benefits of fisheries. The examples discussed here could result in incorrect information and poorly informed scientific conclusions and recommendations that lead to inappropriate management and policy decisions.

Some of these papers also fall under what could be considered scientific neocolonialism, which strives to control development agendas based on a particular world view, and is often detrimental to local communities and other directly affected stakeholders (e.g. [89,90]).

Striving for 30 % no-take or highly protected areas, a global one-size fits all approach, is one such example that has been directly or indirectly supported by some of the published papers presented here. Sydeman et al. [56] provides another instance. In addition to drawing on scientific results that had been criticized on technical grounds and were simultaneously being debated by the relevant South Africa fisheries scientific working group, the authors are all from northern hemisphere institutions and, based on the Acknowledgements, there appears to have been minimal consultation with South African fisheries experts or stakeholders prior to publication of the paper. Nevertheless, referring to a complex issue that directly affects two African countries, South Africa and Namibia, the publication included strong recommendations with ecological, social and economic implications. Editors are not in a position to control practices such as this, but need to be sensitive to the multi-dimensional risks of misleading information that they might presend. They should, at least, ensure that reviewers include local experts with the necessary backgrounds to evaluate all aspects of a paper, although even that can be difficult to achieve.

The media have an important role in amplifying and sharing scientific findings with the wider public and thereby potentially contributing to consideration of this information in policy-making. However, the inadvertent or deliberate spreading of misleading information from scientific publications adds to the potential damage from these documents. Media reports on scientific publications are typically based on press releases prepared by the authors of publications, often in collaboration with media experts. Headlines such as “Protecting 5 % More Of The Ocean Can Increase Fisheries Yield By 20 %” (Forbes12), “Bottom trawling releases as much carbon as air travel, landmark study finds” (The Guardian13) and “Trawling for fish may unleash as much carbon as air travel, study says” (New York Times14), spread false impressions amongst trusting readers. These and other cases of dissemination by the media of misleading results from examples discussed here are provided in Supplementary Table S2.

Recommendations
The previous section contains a number of detailed recommendations arising from this assessment, divided into those aimed at scientists, those relevant to the publishing process, and those directed at the users of science, in this case those involved in the policy-making process.
The overarching recommendation for all those involved in the production and dissemination of scientific results and information is that every effort needs to be made to ensure the reliability of the information produced and used and claimed to be scientific. This group includes scientists, employers and funders of science, publishers and those involved in the publishing process, and the media. Adherence to this is essential for ensuring that trust in science and scientific information is maintained and strengthened amongst all participants in the policy-making process and the public at large.

Journal publishers have ultimate control of the journals, and there-fore of papers published under their names. They need to take the lead towards ensuring the reliability of the papers they publish, giving particular attention to likely high impact papers, especially where policy issues are involved. They have the means and a responsibility to implement the recommendations above relating to peer-review and quality assurance, or to implement whatever other changes are needed to achieve the necessary improvements.

The recommendations for those involved in policy-making centre on implementing procedures to ensure that all information provided under the name of science is scrutinised by a broad group, considered by the stakeholders to be balanced and with the necessary expertise to review the information for accuracy and relevance. The outputs from that process should represent the best available scientific evidence, which should then be made available to all stakeholders in a form that can be readily understood.

The 2030 Agenda for Sustainable Development and the Sustainable Development Goals [9], as well as the myriad of other local, national and foundation of reliable, objective and relevant scientific guidance. The challenges to meeting the Sustainable Development Goals are enormous, often involving difficult decisions on trade-offs as countries implement their particular visions and approaches for achieving them. Failures and weaknesses in scientific support can lead to poor choices, and hinder or undermine progress towards them. This reinforces the fundamental responsibility of scientists and publishers of science to do all they can to ensure quality and accuracy.

We consider that the implementation of the recommendations above would contribute to meaningful improvement in the overall quality of scientific publishing and publications, and reduce the risks of publication and dissemination of erroneous research that can lead to inappropriate policy recommendations.

How do you balance showing the capabilities of the tools (with privacy protection) at your disposal versus counteracting the prevailing press narrative that fisheries are out of control?


Overview of Tuna Fisheries in the WCPO, Including Economic Conditions - 2023 by Francisco Blaha

As is customary at this time, the WCPFC Regular Session of the Scientific Committee meets in Manila this year. A wealth of papers covering all aspects of the stocks and bycatch status of the species the WCPFC deals with are readily available for exploration.

I always look forward to the Overview of tuna fisheries in the Western and Central Pacific Ocean, including economic conditions. The 2023 version was compiled by three people I know and for whom I have the ultimate respect: Tiffany Vidal, Peter Williams from SPC, and Thomas Ruaia from FFA.

Catch value of albacore, bigeye, skipjack and yellowfin in the WCPFC–CA, by longline, pole-and-line, purse seine and other gear types

The publication shows our current situation regarding fisheries, fishing efforts, and the economic conditions in which they work.

This report should be compulsory reading for everyone who wants to say anything about the fisheries in the WCPO (I’m looking at you NGOs)

Dive into the full text and the great graphs, I just quote the abstract below.

This paper broadly describes the major fisheries in the WCPFC Statistical Area (WCPFC-CA), highlighting activities during the most recent calendar year (2023) and covering the most recent summary of catch estimates by gear and species.

The provisional total WCPFC–CA tuna catch for 2023 was estimated at 2,630,858 mt, slightly lower than the 2022 level (2,702,099 mt) and around 342,728 mt lower than the record catch in 2019 (2,973,586 mt). The WCPFC–CA tuna catch (2,630,858 mt) for 2023 represented 79% of the total Pacific Ocean tuna catch of 3,310,318 mt, and 52% of the global tuna catch (the provisional estimate for 2023 is 5,027,799 mt), noting that unlike other oceans, over 80% of the WCPFC–CA tuna catch occurs in the waters of coastal states.

The 2023 WCPFC–CA catch of skipjack (1,647,702 mt – 63% of the total catch) was around 397,077 mt lower than the record in 2019 (2,044,779 mt). The WCPFC–CA yellowfin catch for 2023 (746,913 mt – 28%) was a decrease of 7,457 mt from the record 2021 catch (754,370 mt), noting that 2023 yellowfin catches are the second highest on record. The recent high catches are partially due to the high catch levels from the ‘other’ category (primarily small-scale fisheries in Indonesia).

The WCPFC–CA bigeye catch for 2023 (140,309 mt – 5%) was again one of the lowest of the time series, but relatively consistent with the catch levels from the previous two years. The 2023 WCPFC–CA albacore catch (94,934 mt – 4%) was around 2,741 mt higher than in 2022, but catches from 2021-2023 are the lowest on record since 1997. The provisional South Pacific albacore catch in 2023 was 67,751 mt; however, this estimate is expected to increase with the addition of catches from the Eastern Pacific Ocean, which have not yet been received.

The provisional 2023 purse seine catch of 1,843,100 mt was around 257,000 mt lower than the record catch in 2019 (2,100,135 mt). With respect to species specific purse seine catches, skipjack (1,377,830 mt: 75% of the catch) was slightly below the recent 10-year average, yellowfin tuna (408,281 mt; 22% of the total purse seine tuna catch) was around 92,000 mt lower than the record catch in 2017 (500,506 mt) and the fourth highest annual catch on record, the provisional catch estimate for bigeye tuna for 2023 (56,094 mt) was about 8,500 mt lower than the 2022 catch and a only a slight increase over the notably low purse seine bigeye tuna catch in 2019 (52,081 mt). The increased bigeye tuna catches since 2020 appears to be related to a higher number of associated sets.

The provisional 2023 pole-and-line catch (143,431 mt) is the lowest annual catch since the early- 1960s, due to reduced catches in the Japanese fishery, although we note as in previous years the provisional nature of the estimates at this stage

The provisional WCPFC–CA longline catch (234,894 mt) for 2023 remains lower than the average over the previous decade but a slight increase from 2022 (243,115 mt). The bigeye component of the longline fishery (56,203 mt) was similar to the 2022 catch level - which are some of the lowest catches reported since the mid-1980s. Both albacore and yellowfin catches were higher in 2023 than in 2022.

The 2023 South Pacific troll albacore catch (1,192 mt) was the second lowest catch level since 1980 (744 mt were reported in 1983), largely owing to a contraction in NZ’s troll fleet operating in the region. The New Zealand troll fleet (94 vessels catching 864 mt in 2023) and the United States troll fleet (10 vessels catching 328 mt in 2023) accounted for all of the 2023 albacore troll catch, although minor contributions also come from the Canadian, the Cook Islands and French Polynesian fleets when their fleets are active in this fishery

In 2023, market prices for purse seine-caught products increased. Thai imports averaged $1,773/mt, marking an 8% increase from 2022, while Yaizu prices increased by 12% to $1,923/mt.

Conversely, prices for longline-caught yellowfin decreased across all markets. In Yaizu, prices fell by 28% to $5.07/kg. Prices for fresh and frozen yellowfin from selected ports decreased by 17% to $7.33/kg and 26% to $5.60/kg, respectively. The price from Oceania also declined by 5% to $8.51/kg, partly due to the appreciation of the US dollar against the Japanese yen.

Prices for longline-caught bigeye also declined across most markets except Oceania. In Japan, average prices from selected ports for fresh bigeye fell by 7% to $12.29/kg, and frozen bigeye decreased by 25% to $7.11/kg. However, the price for fresh imports from Oceania increased by 8% to $14.11/kg. In the U.S, fresh bigeye import prices rose by 4% to a record high of $12.03/kg in 2022, before slightly declining by 4% to $11.19/kg in 2023. Thai import prices for albacore decreased by 10% to $3.19/kg in 2023. Similarly, US fresh prices declined by 5% to $5.63/kg, and Japanese selected ports fresh prices fell by 20% to $3.24/kg.

In 2023, the total estimated delivered value of the tuna catch in the WCPFC-CA increased marginally by 4% to $6.1 billion. The purse seine fishery, valued at $3.5 billion, saw a 7% rise from 2022, representing 56% of the total value. In contrast, the longline fishery’s value decreased slightly by 1% to $1.6 billion, while the pole and line catch value dropped by 11% to $312 million, attributed to reduced catches and a decline in the Yaizu price for pole-and-line-caught skipjack. Conversely, the value of catches from other gears increased by 11%, reaching $820 million.

In 2023, the WCPFC-CA skipjack catch was valued at $3 billion, a marginal 2% increase from the previous year, and accounted for nearly half of the total tuna catch value. The value of the albacore tuna catch decreased by 9% to $304 million, while the values for yellowfin and bigeye catches increased to $2.1 billion (+10%) and $784 million (+4%), respectively.

In 2023, economic conditions across purse seine, tropical longline, and southern longline fisheries in the WCPFC-CA improved compared with 2022. The tropical purse seine index improved, remaining above average at 109, driven by rising fish prices and declining fuel costs. From 2018 to 2020, this index stayed considerably above its 20-year average, primarily due to high catch rates. In 2022, the index dropped to 98, its lowest level since 2014. However, it rebounded in 2023, driven by an increase in fish prices, declining fuel costs and higher catch rates.

For the southern longline fishery, 2023 saw a positive trend with the index approaching its 20-year average, supported by higher catch rates and lower fuel prices. Similarly, the economic conditions for the tropical longline fishery improved, nearing the 20-year average, driven by increased catch rates and a decrease in fuel prices.


The EU Catch Certificate and its changes under the new CATCH System by Francisco Blaha

Central to the effectiveness of the EU IUU regulation is the Catch Certificate (CC), a document not easy to handle, so here I will try to “reverse engineer” the ways each section is being handled by the different countries and the CA in the MS that receive them, to clarify its use

The Regulation (EU) 2023/2842 that underpins the use of CATCH, proposed changes in the content of the CC, and processing statement to

  • To address loopholes in key data elements relevant for traceability in the old CC

  • Incorporate key data related to fishing and to tracing trade flows

    To ensure consistency of data collected

    To ensure the same traceability data requirements for the same commodities in all cases.

While the changes are effective from 10 January 2026, “old” catch certificates and documents (those created and validated before 10 January 2026) will be admissible for an additional 24 months from the date of application (if submitted through CATCH).

The changes in each section of the Catch Certificate

There is no "standard understanding" of the interpretation of the CCS contents, and DG MARE does not interfere with the interpretation by EU MS.

This blog is based on my experience with the “old” certificate and the information currently available on the “new” certificate.

This part of the guide aims to facilitate the understanding of the different sections of the CC by analysing them individually,

The “new” information requirements and changes are in light blue type, and new areas in the certificate have a light blue background, while the “old” ones without change maintain the white background.

Section 1

This requires the details of the authority entrusted for this job (usually the fisheries authority) of the flag state. The authority must be “notified” by DG MARE, and it is assumed that under the new system, those authorities in exporting countries may access these “notification requirements” by becoming registered users of CATCH.

However, there is a “catch 22” type situation (pun intended) between the requirements from the EU Catch Certification (CCS) and the Health Certification since some Flag States, while having a fisheries body, lack the EU DG SANTE's authorisation from a sanitary perspective to export. Without this, raw products sourced from such vessels will remain ineligible and, as such, are not part of DG SANTE’s TRACES system (in which CATCH is based).

So, only the countries approved from a sanitary perspective will be “notified”, even if they comply with all the “fisheries elements” of the CCS. This issue will become evident in the analysis of Section 7

The “new” Section 1 differs from the old in naming itself the European Union Catch Certificate to avoid confusion.

Regarding the details above, it is assumed that the CA of the vessel flag State is in charge of managing a unique consecutive numbering system for each cert. The country decides the complexity and structure of this system.

While not listed, it is sensible for the CA of the vessel Flag State to have a dedicated e-mail contact.

Section 2

The new elements in this section aim to increase the details of the vessel's identification and add the gear used for harvesting the fish in the consignment.

The fishing gear code should be under FAO’s international Standard statistical classification of Fishing Gear (ISSCFG)[1]

However, the changes do not address the old system's issues.

Many vessels and landings in one consignment
The CC is based on the volumes in the consignment exported, and the consignment could consist of various landings of various vessels; hence, there could be 20+ vessels in one consignment in the paper system; there was no chance to put more than 2-3 vessels in this section.
FFA members “invented” Annex B to add more vessels; hence, we assume that the new system may allow the addition of as many vessels as necessary for the consignment.

No role for coastal States
The fishing licence # and validity in the certificate seem to refer to the flag state license and not to the coastal state where the vessels may be operating.  Yet the legality of the catch is associated with the conditions imposed by the coastal state and not only by the flag state. Furthermore, the validity may differ (yearly for the flag state and monthly for the coastal state), so it gets complicated, and the CCS remains silent on this. Based on this, the numbering of the licence and validity of the vessel by the flag state may not have any inference with the legality of the catch.

Charter vessels
As discussed, the issuing and validating of the catch certificate is done by the flag state fisheries authority. Yet, a significant part of the fishing world works on principles of “charter”; hence, vessels flagged in country “A” are based and operate in country “B” under its legislation and controls. Chances are that flag state “A” may not have seen that vessel in years and may not even know where it is, but under flag state responsibility is the flag state (A) that had to validate the catch certificates of the vessels that operate in country B.

So, in an ideal world, country “A” would establish an MoU with the Coastal States where the vessels operate and/or with the Port State where the fish is landed/transhipment and/or with the processing state where the fish is processed (note that all this can happen in one country or different ones). Once these MoUs are in place, a robust information-sharing system can be established, enabling the flag state to provide the required “official assurances” during validations.

In the real world, most of the countries utilising charter vessels are not particularly responsible in terms of fishing compliance. Hence, they don’t give much attention to these issues (in fact, very few such MoUs are in place).

While initially, this was designed as a “Catch certificate” (hence certified the fish caught at the time of landing), it has always been used as an “export certificate” only for the fish being exported to the EU, in many cases not from processors based in the flag state of the harvesting vessel.

So this becomes a problem for the processors and exporters in the countries that process the fish being exported to the EU, as they depend on the willingness and efficiency of the flag state authority, even more so if the flag state CA does not use CATCH.

Sections 3 and 4

The changes in these sections aim to increase the available catch area and date information and clarify the issues of the weights to be presented in the CC, which was a matter of much confusion in the old one.

The catch area FAO area(s) refers to FAO’s statistical catch areas[2]; furthermore, the information should include the identification of the exclusive economic zone(s) and/or high seas and where the catches took place.

 The changes do not address fully some of the old system's issues and remain somewhat mixed and complicated.

Section 4 relates more to Section 2 in the function of the conditions under which the vessel operates and catches fish; hence, it is analysed first.

It refers to the applicable Conservation and Management Measures (CMMs) applicable to the vessels and area of catches; this has been a confusing aspect, as an example; a vessel from a WCPFC member fishing in the area may be under the obligations of over dozens of CMMs[3] that are incorporated into the fag state legislation (high seas permits, conditions related to leaving the flag state EEZ, observers, FADs, and all other CMMs applicable to the WCPFC in which that vessel operates) and/or the measures imposed by the coastal state (permit # and conditions, etc) which as discussed above seems absent.

In any case, it only relates to the relevant RFMO convention area(s), so one assumes that naming the WCPFC is sufficient.

Section 3.

Product Description: The product is described by using the species name, and the product code is the customs code used in the nomenclature implemented by the third country (however in reality, it is the one that the client requested) in the sections below. However, some countries ask for the product's generic name to be listed (i.e. Tuna loins).

Catch dates and areas: Dates of catch can be interpreted as the actual dates of fishing. However, a vessel may not catch every day, so certainty is required regarding whether this constitutes each active fishing date, the time between the 1st fishing operation (i.e. trawl, set, hook in the water, etc.) and the last one. This could also be from port departure to return or from empty hold to full hold, depending on how the vessel operates.

This is not defined; hence it is potentially in the hands of the operators that complete this section to choose what they want, or it may also be subject to a directive from the fisheries authority defining what is required.   

Weights: The clarifications for this section, as explained in DG MARE’s FAQ of May 2024[4], are very welcomed since the ones in the older system were complex and somewhat confusing. Question 48 of that document states

  • Estimated weight to be landed in kg” - this box will be used in direct landings of fishery products in the EU. It will contain data based on the fishing logbook.

  • Net catch weight in kg” - this box will be used in case of landings in third countries. It will contain data after completion of landing relevant for the products intended to be exported to the EU.

  • Verified weight landed (net catch weight in kg) - this box will be used in case of landings having taken place under the supervision of an authority.

What often used to happen is that when fish from a vessel flagged in country “A” was unloaded in country “B” for processing, the whole volume of fish landed can be quoted in the “estimated” box. So now it is advised that this volume only applies to fish landed in the EU.

The one that seems applicable to landing in 3rd countries is the “Net Weight”, the note does not go into details. Still, it would be great to assume this for the full landing. Then, the processing statement provides the details of the processed volume out of the landed, and the CATCH system keeps track of this for each landing of each vessel in the CC and incorporates some standard conversion factors/yields to keep subtracting the volumes processed of the volume landed until the full net volume is exhausted.

No details are provided regarding the verified weight landed, yet one is to assume that this could apply to the port State authority if fish is landed in a country other than the flag state.

While the present understanding is a step forward from the old one, DG MARE will need to clarify some aspects further.

Section 5

The changes here add the option of a licensee holder since masters were usually unavailable to sign.

While is ideal to make the master responsible for the fish caught, the certificate is often raised when the product is ready to be exported, which usually means processed (not for the product caught).

This may happen in a different country and months after the vessel lands, and therefore, the master will not be able to sign the document.

In theory, the fisheries authorities should validate this. Yet, most operators have scans of the skipper’s signatures available or add the concept of “authorised company representative” or something similar to the paper certificates. 

Section 6

Transhipments at sea are heavily regulated worldwide and good reasons exist for this.

Transhipments are permitted in various fisheries and under the fishing rules of the flag state and/or RFMO, and/or coastal state.

Nevertheless, it is the Flag state’s responsibility to attest to the legality of transhipment at sea. Hence, the flag states should have processes and instruments to ensure the operations are legal and no underreporting occurs.

Some difficulties apply here in addition to the other elements of the CC. The paperwork may be completed soon after the event and handled by the processors rather than the fishers. So, in this case, how does the flag state know and validate the identity (and signature) of both masters?

While there is no definition of “transhipment at sea” it is almost obvious that it happens outside any port region, and many states have not defined the “format” in which the transhipment information is to be supplied.

Examples have been cited where the CC declares two dates and positions (start and finish of the transhipment). This may suggest that there were two transhipments instead of one.

Indeed, there could also be two consecutive transhipments by the same vessels separated by a few days.

Thus, it is important that the validation authority clearly states how they require the information to be presented.

Section 7

The changes here address a substantial failure of the old system, the lack of a section for landings and an absence of Ports State Measures in the CCS.

Furthermore, the EU is a party to PSMA and actively participates in the FAO Technical Consultation, which elaborated the 2022 Guidelines for Transshipment and agreed to the definition of transhipment and landing.

The new form correctly identifies the ports the dates of transhipment or landing and the details of the vessels receiving transport in case of transhipments.

In any case, the changes do not address some of the old system's issues and remain complex and somewhat confusing.

While not clearly explained in the regulations or manuals, this is the only part of the CC that requires the signature from the Port State instead of the Flag State.

When vessels flagged in Country “A” tranship or land at a port in Country “B”. Country “A” is responsible for the validation of the CC, but Country “B “is responsible for authorizing the transhipment or landing under PSM.

The transhipment or landing can occur before the CC certificates are raised and validated (in many cases, there is still no firm buyer for the fish) or because the fish has not been landed or processed at its destination, which may or may not be the Flag State.  

This a difficulty for the Port State as under the paper system, if they were to sign Section 7 at the time of the transhipment or landing, they'll sign an empty CC, unless the flag state is really “onto it” an able to provide a validated CC based on reliable estimates prior the transhipment (there is no evidence of this ever being the case).

Alternatively, they need to keep the records of the transhipment authorization on file until the processors of the fish that was transhipped/landed request the CC from the Flag State, who can then issue and validate the CC, which can then go to the Port State for section 7 signature.

As it is now, the operational side of section 7 requires either jeopardy from the Flag State or from the Port State.

It's only hope that under CATCH, the communication between the flag state and port state may be working over the same CC initiated by the flag State.

As discussed before, CATCH can incorporate countries that are not authorised from the sanitary perspective, something it cannot presently do on TRACES.

Section 8

There are no changes to this section, that is normally completed by the processor that fills Section 5, as the CC is prepared by the processors (which, as already discussed defeats the purpose of a catch certification), so in general terms there are no issues with this section.

Section 9

This section, which refers to the authority in charge of Section 1, has not been changed. However, a name and position are required.

Initially, it was believed that the details should be communicated to DG MARE. Yet the CC is evaluated by the CA of the EU MS, and there is no centralized system to verify (or not) the details of the CC. It is, therefore, up to the EU member state to decide whether to inform DG MARE.

Section 10

There are no changes to this section which is a rather illogic part of the certificate which could just be the appendix (transport details) or simply not referred to.

The “new” transport details appendix does, however, incorporate changes that refer to the documentation details, such as the CMR (Contract for the International Carriage of Goods by Road), the inclusion of a port of destination, and the instruction that in the case of use of multiple modes of transport or multiple shipments, the information related to the transport has to be provided for each mode of transport used for each.

The appendix collects the information related to the transport details of the fishery products from the third country, having validated the catch certificate to the next destination, an EU Member State in case of direct importation or an intermediate country in case of indirect importation to the EU.

Yet, as has been seen under part 7, if a transhipment in port happens in between vessels where the Port State is the Flag State, then this can also be construed as having the carrier as the de facto transport vessel. In this case, the carrier's details will be entered in this section.

There are also instances where the transhipment details being recorded in section 7 are the same details of the carrier being repeated in this section of transport details.

Acceptance of this practice may be one of those issues that is dependent of the practices of the authorities of importing EU MS at the time the consignment enters the country.

Processing Statement

The processing statement, as required by Annex IV of the IUU Regulation, has gone through a full change of understanding.

While it used to be only required for fish processed under a foreign catch certificate in a 3rd country, it will now be required even in cases where the processing of the product takes place in the same country where the flag of the fishing vessel.

From now on, processing statements will be required for ALL processed fishery products imported in the EU, regardless of where the processing has taken place (in the flag State or in another non-EU country).

This means that processing statements should also be endorsed in cases where the flag State of the fishing vessels that caught the fish and the country where the processing operation occurred are the same.

In addition, the template laid down in Annex IV will include the obligation to apply a unique number provided by the authorities endorsing the statement (in case of direct use of CATCH, the system can generate such a unique number directly).

Importantly, the processing statement should refer to the related catch certificates, including the quantity of fish used as raw material to produce the processed products to be exported to the EU. As discussed before, hopefully, this is checked in terms of the standard yields for the type of processing.

There are no significant issues regarding this document. From the practical and management point of view, it is important for the CA of the processing state that validates this document to maintain a register of processing statements signed with a description of species, volumes and destiny.

A Non-Manipulation Statement?

The legislation did not stipulate a “non-manipulation statement”, but it stated that:

In order to import fishery products constituting one single consignment, transported in the same form to the EU from a 3rd country other than the flag State, the importer shall submit to the authorities of the Member States of importation:

  1. the catch certificate(s) validated by the flag State; and

  2. documented evidence that the fishery products did not undergo operations other than unloading, reloading or any operation designed to preserve them in good and genuine condition, and remained under the surveillance of the competent authorities in that third country.

Documented evidence shall be provided by means of:

  • where appropriate, the single transport document

  • A document issued by the competent authorities of that third country:

    • giving an exact description of the fishery products, the dates of unloading and reloading of the products and, where applicable, the names of the ships or the other means of transport used and

    • an indication of the conditions under which the fishery products remained in that third country.

Hence, some FFA members developed a ‘Non-Processing Statement” to cover all these issues and assist with their “fish accountancy”. An example follows:

Under the new system, there would be an official template for this document (not yet published)

Annex B or attachment to Catch Certificate

This form was not published in the original legislation; hence, it is not a compulsory form. In a note published by the EU on their website in July 2010, the EU welcomed the use of it for domestic products (i.e. products caught by the flag state vessels in this case). They do not standardise the contents. Hence, countries can adapt it to reflect their systems and the outcome based on traceability.

The EU noted: "Discussions are presently carried out with other third countries to provide similar information regarding domestic processing activities. The Commission welcomes the support received from third countries and their positive approach to implement the IUU Regulation". Hence, the third countries should use this to their advantage.  

The certificate itself is still filled as usual, but then sections 2 and 3 will refer to the attachment or Annex B.

This form is handy when the consignment is made from various landings of various vessels (as is common in canneries), as the form can replace otherwise 30 “individual” certificates.

It is easier to set up the information in a readable way, including the volumes landed, the volumes processed, and the volumes exported. The Container number where that product is stored for dispatch, hence the whole traceability of the product is “visible” in one document; an example is presented below:

As discussed for Section 2 of the CC, it will depend on the facilities under the new CATCH system to add many vessels if applicable.

So yeah… one big thing is the processing statements change,… something that could have been done 14 years ago already. However, I see the capabilities of CATCH to do “fish accountancy” and check when a vessel landing is exhausted even with high yield margins during processing, and then see how much of the fish flows into the EU diminish… that is the ultimate test of the effectiveness wich so far hasn’t shown much in terms of impact in trade.

[1] https://www.fao.org/fishery/en/knowledgebase/139

[2] https://fish-commercial-names.ec.europa.eu/fish-names/fishing-areas_en

[3] https://cmm.wcpfc.int

[4] https://oceans-and-fisheries.ec.europa.eu/document/download/4b92c8f5-9f96-46ec-babc-3bc880ff4ad3_en?filename=FAQ-amendment-IUU-Regulation_en.pdf&prefLang=fr

Data and digital technology challenges for maritime human rights concerns by Francisco Blaha

As I dug deep last year into a (yet-to-be-published) study for the ILO on using Electronic Monitoring (EM) for labour rights issues at sea from an operational perspective, I could foresee the broader-picture challenges associated with EM in that context.

So I was pretty pleased to find out that this paper, as the issue was tackled not by fisheries people but by some very clever people from the Alan Turing Institute in London who work on the intersection of human rights, social issues, data, technology, and AI… which must a quite remarkable space to work… as each of them is already massive. (I would love to know more, and ideally work with them)

And I was even happier to read the following sentence.

Regarding maritime human rights, we argue that prioritising large-scale, top-down monitoring to collect larger datasets or market more tech solutions is not the best way for data and technology to contribute to transparency and accountability. Instead, we advocate for deeper engagement with affected communities.  

This aligns very much with my advice on the ILO paper… yes… is potentially possible, and we will need to adapt some of the tools we already have for EM for IUU and fisheries management and develop newer ones besides the issues around governance roles and responsibilities… yet still an “ambulance a the bottom of the cliff”… the right thing is to prevent the problems to happen by engagement and economic penalties on the worst performing flag states… which are legally responsible on what happened on board.

Basically... tech may help… but Tech won’t save us! (a great podcast, by the way)

The paper reviews many findings from studies on fisheries (one of which I am a co-author) and maritime human rights investigations, emphasising the importance of a comprehensive approach combining traditional investigative methods with innovative technological solutions. It advocates for community empowerment, ethical data practices, and the integration of digital tools while upholding ethical standards and ensuring contextual specificity in tools. And that is something I’ll totally agree with.

In any case, and a usual… I recommend you read the original Trouble at Sea: Data and digital technology challenges for maritime human rights concerns. Is a great paper

I quote below the abstract and conclusions.

ABSTRACT
Recent years have revealed the severity and scale of human rights abuses at sea. Yet maritime human rights investigations remain challenging due to an array of difficulties, including physical inaccessibility and a complex legal environment. Improving the availability of data has been framed as a solution that will enhance transparency in marine-related activities and improve accountability for rights violations. Such enthusiasm has fuelled the development of technological solutions promising to identify abuses and safeguard vulnerable individuals. However, these efforts clash with concerns over the use of data and technology in human rights practice. In the context of such tensions, this paper studies how data and technology have been integrated within investigations into rights abuses at sea. We examine the challenges posed by transparency, accountability, and fairness regarding communities affected by rights violations. We ask: do data, and digital technologies offer effective means for helping to expose rights abuses and hold malicious actors accountable? Or do they introduce new threats to autonomy, privacy, and dignity? We present empirical research based on qualitative engagements with expert practitioners. We find:

  1. an increased availability of datasets did not necessarily prevent harm or improve safeguarding for vulnerable people;

  2. many tech solutions were detached from affected individuals’ lived experiences and appeared not to meet communities’ needs;

  3. uses of data and technology could introduce or aggravate risks to fairness and accountability within human rights investigations.

 We contribute a much-needed reflection on the actual implications of the use of data and techno- logical tools for communities affected by human rights violations. Regarding maritime human rights, we argue that prioritising large- scale, top-down monitoring to collect larger datasets or market more tech solutions is not the best way for data and technology to contribute to transparency and accountability. Instead, we advocate for deeper engagement with affected communities. 

CONCLUSION
Oceans are a critical arena in global efforts to promote human rights. Increasing attention paid to maritime human rights issues has exposed the scale of the problems at hand. These discoveries have been driven, in part, by advances in data and the technology used to analyse it.

Like other areas of human rights practice, datafication appears to have introduced new skill sets, epistemologies, and professions into the space.

But despite the degree of interest in the academic literature in leveraging various data sources and developing technical solutions to the problem of challenging human rights abuses at sea, our research indicates these have not necessarily made marine spaces more transparent, increased the accountability of malicious actors, or improved safeguarding for vulnerable individuals.

Meanwhile, we observed a familiar series of concerns regarding data-driven technical interventions: they were said to introduce errors, contribute to biases, and lead to misinterpretations, which could all reduce investigations’ efficacy and feed unfair disparities in outcomes.

They could encourage technological solutionism, crowd the market for tools, and divert resources from where they were most needed. This misalignment—between affected communities’ needs and technology developers’ efforts—was spurred by a socio-technical environment where investments in ‘high tech’ solutions and their providers have been privileged.

We argue the path for data and technology to contribute to fairness, transparency, and accountability within efforts to challenge maritime human rights abuses is not through further investment in large-scale, top-down monitoring to collect larger datasets. Nor is it through pursuing more sophisticated tech solutions in a crowded market where existing products may not be meeting users’ needs. Instead, the field demands deep, localised engagement that supports affected communities to exercise their own agency. In a resource-constrained environment battling against severe harm to individuals and communities, the stakes of under-utilising or misplacing resources are high.

Our findings (Table 3) are likely to be echoed in other human rights fields and in the broader ‘tech for good’ sector. In particular, we suggest the needs, difficulties, and concerns that practitioners raised about investigating maritime incidents will be relevant to human rights investigative work in contexts where data is scarce and/or of low quality. These might include work to identify labour exploitation on land; investigations in areas with limited internet access or available data; and initiatives seeking to document events during armed conflict.


A deep dive into the South Korean Carriers generalised FADs setting activities in the WCPO by Francisco Blaha

Beyond the initial furore around the Sun Flower 7, I have occasionally posted on the behaviour of Korean Carriers acting as fishing boasts when setting FADs without any Observer’s supervision outside the EEZs of FFA/PNA members since the WCPFC is the only tuna RFMO that does not have an independent observer programme on carriers (I have written on this before).

But honestly, I barely have time to write these blogs, even less to do a deep dive (for free) into how generalised (and entrenched) the behaviour is among carriers that have South Korea as a country of beneficial ownership.

Yet, thankfully, Megan Charley from Starboard did so in this excellent case study published on the Starboard website. Her credentials and capacity for the job are impeccable. She was an intelligence officer with the Australian Defence Force and Border Security, then went to AFMA. Now she is with Starboard; she does not leave stones unturned and asks the right questions.

Carrier AIS track history including FAD setting activity across the Kiribati and Tuvalu EEZs over 2 years, coinciding with favourable tuna fishing grounds. This figure has a chlorophyll-a environmental layer applied through the Starboard map layers, showing higher concentrations of chlorophyll-a in darker shades of green.
The source is the linked study

So when she reached out to me with this study, I was more than happy to help… even if I think that what I mostly did was to respond with more questions and endless blogs!

So, this case study covers almost everything that is know about the generalised FADs setting activities in the WCPO by carriers belonging to a closely interconnected group of South Korean beneficial owners.

Identified relationships between 4 major companies operating South Korean (including those flagged to other countries such as Panama and Kiribati) fish carriers, purse seine support carriers, purse seine fishing vessels, and other fishing vessels.
The source is the linked study

Below, I quote the “conclusions” in the form of “observations” compiled as a result of her case study/analysis for further consideration, but please refer to the original. It is very well illustrated and analyses vessel-by-vessel activity and ownership.

  • Carrier vessels should be closely monitored during the current closure period of 1 July–15 August 2024, in particular for more subtle manoeuvres that could indicate FAD setting.

  • Requests to flag-states or the WCPFC Secretariat for their additional FAD closure months (or CNM restrictions on carrier FAD setting in general) can be made by authorised enforcement agencies during relevant operations to analyse and report on any potential FAD setting activity.

  • Consideration for the additional flag-specified closure periods being made public for more effective monitoring and compliance efforts.

  • Consideration for further analysis outside of closure periods on the amount of FADs potentially being released and not recovered by carrier vessels, and whether this constitutes illegal dumping under international law.

  • Whether the role and classification of carriers as fishing vessels under the WCPFC Convention Text and ancillary CMMs should be reviewed, to determine whether fishing activities such as FAD setting should be allowed for carrier vessels (and if so, whether it should be monitored by observers).

  • Improved information sharing between flag-states and port-states for effective collaboration and implementation of PSM controls to enable the denial of port entry for more IUU vessels and overarching companies.