The environmental niche of cheap longlining in the high seas by Francisco Blaha

And the IAS dataset papers just keep coming, and here one that that put focus on High Seas longliners activities and bring all sets of well grounded reasons on how and why they operate there. As the cheap shot I am, I share my colleague Tim Adams opinion: is the refuge for the cheap operators. There is no license to pay to fish on the high seas, their flag state pays their contributions to the RFMOs and they provide high seas permits like if they are free candies. That is motivation enough to hang out there.

2013-04-03 17.04.01.jpg

I find the graphs showing the concentration of the longline effort on the edges of the Pacific Islands Countries EEZ's, where they fish without paying anything, really upsetting but that is the reality, and that "transparency" is perhaps the biggest contribution of all these IAS based papers. (I also find upsetting that they cat the Pacific in half and all these fisheries maps are "Atlantic centric", but that is a different topic

Anyway, as usual, read the paper "The environmental niche of the global high seas pelagic longline fleet" and draw your own conclusions, I quote below some of the parts I like.

Abstract
International interest in the protection and sustainable use of high seas biodiversity has grown in recent years. There is an opportunity for new technologies to enable improvements in management of these areas beyond national jurisdiction. We explore the spatial ecology and drivers of the global distribution of the high seas longline fishing fleet by creating predictive models of the distribution of fishing effort from newly available automatic identification system (AIS) data. Our results show how longline fishing effort can be predicted using environmental variables, many related to the expected distribution of the species targeted by longliners. We also find that the longline fleet has seasonal environmental preferences (for example, increased importance of cooler surface waters during boreal summer) and may only be using 38 to 64% of the available environmentally suitable fishing habitat. Possible explanations include misclassification of fishing effort, incomplete AIS coverage, or how potential range contractions of pelagic species may have reduced the abundance of fishing habitats in the open ocean.

Results

High seas longline fleet composition and distribution
After analyzing all satellite-based AIS fishing effort data from GFW, we found that longline fishing effort in the high seas accounted for 84 to 87% of the fishing effort (by hour) across gears during the study period (fig. S1). While longline fishing effort is lower in ABNJ, it represents a major top-down pressure on oceanic ecosystems (27). Of the high seas longline fishing effort, 88.9% (2015) and 80.4% (2016) were attributable to five fishing States or territories: China, Japan, South Korea, Spain, and Taiwan (fig. S2). Taiwan dominates global longline fishing effort (by hour) in the high seas, followed by Japan, Spain, China, and South Korea. Our analysis focuses on these top-five fishing States or territories. AIS-derived fishing effort data show that the distribution of longline fishing effort in the high seas changes across space (Fig. 1) and time (Fig. 2). During 2015 and 2016, the tropical (23.5°N to −23.5°S) and temperate (66.5°N to 24.5°N and −24.5°S to −66.5°S) regions contained 64.6 and 35.3% of the global fishing effort, respectively. On average, the intensity of fishing effort in the high seas is higher during the boreal summers and peaks in July and August during 2015 and 2016, respectively (Fig. 2). The overall increase in fishing effort data between years is likely driven by an increase in the number of orbiting satellites capable of detecting AIS signals, as well as an increase in the capability of detecting and classifying longline fishing effort by the GFW group. Despite the increase in fishing effort intensity, the seasonal pattern where global longline fishing effort increases during the boreal summer months seems to be preserved between the two years. Untangling the drivers of the observed seasonal patterns of fishing effort requires a regional, fleet-specific approach that includes information about target species, fishing seasons, and quotas. All fishing effort data needed to evaluate the conclusions in this paper are available from GFW.

Fig. 1 Distribution of global pelagic drifting longline fishing in ABNJ in 2015 and 2016. (A) 2015. (B) 2016. Light gray areas depict exclusive economic zones (EEZs) that were excluded from this study.

Fig. 1 Distribution of global pelagic drifting longline fishing in ABNJ in 2015 and 2016. (A) 2015. (B) 2016. Light gray areas depict exclusive economic zones (EEZs) that were excluded from this study.

Monthly persistence maps provide a visual representation of the global changes of fishing habitat suitability throughout the year (Figs. 3 and 4) and help identify areas of the high seas where favorable environmental conditions for longline fishing are most stable. The monthly persistence maps also help identify areas of the high seas that are not classified as environmentally suitable for longline fishing throughout the year, which provides valuable information about which areas may be experiencing less longline fishing pressure.

F4.large.jpg

CONCLUSIONS
As we combine an improved understanding of open-ocean fleet behavior with knowledge of the drivers of distribution of target and nontarget marine taxa, our ability to predict the co-occurrence of fishing with sensitive species or ecosystems will improve, as will the efficacy of related management measures. As the intensity and overlap of human uses of ABNJ continue to grow, ocean governance structures will have to rely more heavily on different forms of dynamic spatial management to accommodate all users and activities, which, in turn, rely on open-access remote sensing data and collaborations between researchers, fishers, and the management community Our research demonstrates how the global pelagic longline fleet exhibits predictable environmental preferences for various biophysical and physiographic predictors, which can be used to explore the current and future distributions of fishing fleets. Improvements in remote sensing and oceanographic forecasting for variables (for example, SST) open new opportunities for the implementation of adaptable ocean management measures that match the dynamics and distributions of ocean biological resources and resource users. As we grapple with rapidly changing oceans and ocean uses, advancements in predictive modeling, aided by new technologies, will help us move away from reliance on retrospective tactics in area-based management and toward more dynamic approaches capable of delivering ecosystem-based management.


The rise of the DWFN by Francisco Blaha

Among the plethora of papers coming out of via the IAS dataset and some clever data analysis, here is another one that shows and set numbers to things we suspect. This is on a analisys on the activities of the main Distant Water Fishing Nations (DWFN). So, I make it short and sweet (and say a bit about an issue I have with the methodology)

yeah... we fishing here but the money goes that way

yeah... we fishing here but the money goes that way

Of course read the original: Far from home: Distance patterns of global fishing fleets, and make your own conclusions.

The abstract 
Postwar growth of industrial fisheries catch to its peak in 1996 was driven by increasing fleet capacity and geographical expansion. An investigation of the latter, using spatially allocated reconstructed catch data to quantify “mean distance to fishing grounds” found global trends to be dominated by the expansion histories of a small number of distant-water fishing countries.

While most countries fished largely in local waters, Taiwan, South Korea, Spain, and China rapidly increased their mean distance to fishing grounds by 2000 to 4000 km between 1950 and 2014. Others, including Japan and the former USSR, expanded in the postwar decades but then retrenched from the mid-1970s, as access to other countries waters became increasingly restricted with the advent of exclusive economic zones formalized in the 1982 United Nations Convention on the Law of the Sea.

Since 1950, heavily subsidized fleets have increased the total fished area from 60% to more than 90% of the world’s oceans, doubling the average distance travelled from home ports but catching only one-third of the historical amount per kilometre travelled. Catch per unit area has declined by 22% since the mid-1990s, as fleets approach the limits of geographical expansion. Allowing these trends to continue threatens the bioeconomic sustainability of fisheries globally

Results
Analysis of the mean distance travelled by the industrial fleets of the world’s 20 largest fishing countries between their home countries and the locations where catches were taken illustrates three distinct patterns: rapid and largely continuous expansion (Fig. 1A), early expansion followed by stabilization or retrenchment (Fig. 1B), and limited or no expansion (Fig. 1C). The fishing fleets of Taiwan, South Korea, Spain, and China have continuously expanded their mean distance to fishing grounds by at least 2000 km since the 1950s, with the first three of these now fishing, on average, more than 3000 km from their home ports (Fig. 1A).

These are globally operating distant-water fleets and flag states, accounting for nearly 20% of the global industrial catch over the last decade (Fig. 1A). Spain was already fishing, on average, nearly 1500 km from home at the start of global data records in 1950 (Fig. 1A), largely driven by the country’s long history of fishing for Atlantic cod off the Canadian east coast. Five countries or former countries that currently account for about 27% of global industrial catches showed expansion during the early postwar decades but appear to have curtailed or consolidated their distant-water operations since then (Fig. 1B). This includes the former USSR, which had a large distant-water fleet during the 1950s and 1960s, operating, on average, more than 2000 km from home. In scale and early timing of expansion, the former USSR is only exceeded by Spain, South Korea, and Japan (Fig. 1, A and B).

However, while Spain and South Korea have continued a fairly monotonic expansion, the countries of the former USSR began to retrench in the 1970s. Japan, after rapid postwar industrial expansion, also consolidated its fishing effort within the Indo-Pacific region starting in the 1970s (Fig. 1B). The remaining 11 of the 20 largest fishing countries, accounting for 33% of global industrial catches, have shown little or no expansionist efforts over the last 65 years (Fig. 1C).

Fig. 1 Trends in the distance traveled to fish from 1950 to 2014.

Fig. 1 Trends in the distance traveled to fish from 1950 to 2014.

Norway has begun to fish relatively further afield in recent years, likely driven by the rapid growth in contribution of its Antarctic krill (Euphausia superba) fishery from<1% of the national total catch in 2006 to 7% in 2014 (www.seaaroundus.org). For the top 20 fishing countries, catches caught on the high seas or in the EEZs of other countries grew by more than 600% between1950 and 2014, increasing their contribution to global catches from16 to 23% over this period (www.seaaroundus.org). Catches by distant-water or“foreign” vessels have therefore grown faster than catches by countries within their own waters, illustrating the increasing importanceof distant-water fishing among the countries that supply most of the world's wild-caught seafood.

Driven strongly by the trends in fishing distance among the 20 largest fishing countries, the net effect since 1950 is a global doubling of the mean distance fished from port (fig. S1). However, this net expansion has been associated with a strong decline in the catch obtained per kilometre travelled over the 65-year time period. Catches declined from more than 25 metric tons per 1000 km travelled in the early 1950s to approximately 7 metric tons per 1000 km travelled by 2014 (Fig. 2).

The global industrial fishing catch increased fivefold between 1950 and its peak of 100 million metric tons in 1996 but has declined steadily by around 18% over the two decades since (Fig. 3A). In contrast, the percentage of total ice-free ocean area used for industrial fishing increased rapidly from 60 to 90% during the 1950s and 1960s, plateaued through the mid-1990s, and has expanded by less than 5% in the last two decades (Fig. 3B). The combination of these two patterns suggests that industrial catch per unit area of ocean fished expanded through peak catch in 1996 but has since declined by 22% (Fig. 3C)

Fig. 4 Spatial mapping of the distribution and intensity of industrial fishing catch. Mean industrial fisheries catch in metric tons per square kilometer by catch location during the (A) 1950s and (B) 2000s.

Fig. 4 Spatial mapping of the distribution and intensity of industrial fishing catch. Mean industrial fisheries catch in metric tons per square kilometer by catch location during the (A) 1950s and (B) 2000s.

--- 

I find very illustrating graph 1 as it represent what I have seen worldwide, and I like the sentiment of the paper. Yet, the author's headline-grabbing line stated that the total fished at the present is more than 90% of the world’s oceans. But that's only if you count one catch in every 1/2° × 1/2° latitude and longitude cell as "fished" (That is 51km x51km). So, the smaller the grid (cells) the less of the ocean is fished. If each cell is 1 ocean, 100% has been fished, if is cell is a 1cmx1cm most would be unfished?

Furthermore, a lot of transit and drifting happens, which is not fishing. When I analyse VMS tracks you see that there is a lot of ocean navigated but not fished.

Maybe "90% of the oceans have been navigated by FV when we divide the oceans in 51x51 km grid cell be more accurate, but them... surely less headline-grabbing.

High seas fisheries play a negligible role in addressing global food security by Francisco Blaha

A lot is written at the moment of the High Seas (or Areas Beyond National Jurisdiction – ABNJ), form various angles. A lot of the press portrait it as an unprotected and lawless place, but as my friend, Mercedes Rosello recently (and graciously) wrote: "There *are* protections! Yes, they are limited and imperfect. That means that they need to be complemented, reinforced, implemented, and enforced. *Ignoring* them is not the way forward!.

Not as much as they make you believe

Not as much as they make you believe

The high seas Is a deserved area of interest, (I often write about what is happening there). A question that is not regularly evaluated is why people go fishing there? Is not close and accessible, but not utterly lawless as I recently read.

Is there so much fish there that the DWFN need to operate there to survive? Or is geopolitics? Or is just that are working in areas adjacent sometimes and it does not cost much to get there… in fact, they don't have to pay licenses to be there to anyone, not even to RFMOs. So there is a lot of questions that are there and are being answered, mostly by academics that have the time and funds to do it! I only have a lot of questions and a lot of work… so tough luck for me in finding the time to work on that!

In any case, a card that has been played by the DWFN is that the catches in the High Seas are a vital part of food security. 

Yet my “friends in fish” Laurenne Schiller and Megan Bailey (I recently loved another publication by them involving Dr Seuss) with other 2 authors, got into that assertion and very originally (just because they are clever and original people) titled their latest paper (published yesterday) with the conclusion of their work: “High seas fisheries play a negligible role in addressing global food security”

And yes, their paper deals precisely with that, it proves that the food security argument is just not substantiated by data or facts. As usual, I recommend you read the original, I just quote some of the parts I found more interesting.

Abstract
We analysed high seas catches and trade data to determine the contribution of the high seas catch to global seafood production, the main species caught on the high seas, and the primary markets where these species are sold. By volume, the total catch from the high seas accounts for 4.2% of annual marine capture fisheries production and 2.4% of total seafood production, including freshwater fisheries and aquaculture. Thirty-nine fish and invertebrate species account for 99.5% of the high seas targeted catch, but only one species, Antarctic toothfish, is caught exclusively on the high seas. The remaining catch, which is caught both on the high seas and in national jurisdictions, is made up primarily of tunas, billfishes, small pelagic fishes, pelagic squids, toothfish, and krill. Most high seas species are destined for upscale food and supplement markets in developed, food-secure countries, such as Japan, the European Union, and the United States, suggesting that, in aggregate, high seas fisheries play a negligible role in ensuring global food security.

To assess the contribution of the high seas catch to global food security, we determined (i) the contribution of the high seas catch relative to other sectors of seafood production, (ii) the main high seas fishing countries, (iii) the species composition of the high seas catch, and (iv) the primary importing countries and associated markets for those species. We used annual catch statistics from the Sea Around Us reconstructed fisheries database (v. 47), aquaculture and freshwater production estimates from the UN and Food and Agriculture Organization (FAO) (4), and import and export data from the FAO FishStat database (v. 3.01).

Fig 1:&nbsp;Average contribution (million metric tons) of seafood-producing sectors, 2009–2014

Fig 1: Average contribution (million metric tons) of seafood-producing sectors, 2009–2014

High seas catch by volume
Between 2009 and 2014, the total landed catch on the high seas was an average of 4.32 million metric tons annually. This volume represents 4.2% of the annual marine catch (102 million metric tons) and 2.4% of all seafood production, including freshwater fisheries and aquaculture (178 million metric tons; Fig. 1

High seas catch by species
Thirty-nine fish and invertebrate species accounted for 99.5% of the high seas catch identifiable to the species level during the time period sampled. Only one of those species, Antarctic toothfish, was caught exclusively on the high seas (3700 metric tons annually) and represented 0.11% of the total high seas catch. The remaining species are “straddling” and/or highly migratory species (that is, caught both on the high seas and within EEZs). The top three species caught on the high seas were all tunas: skipjack (967,000 metric tons annually), yellowfin (563,000 metric tons annually), and bigeye (336,000 metric tons annually). The tunas (these species plus albacore and the three bluefins) collectively accounted for 61% of the total high seas catch by volume. Other main species groups were non-tuna pelagic fishes (26%), pelagic squids (7%), billfishes (3%), demersal fishes and invertebrates (2%), and krill (1%)

High seas catch by producers and consumers
Ten fishing countries were responsible for 72% of the total high seas catch between 2002 and 2011. China and Taiwan alone accounted for one-third of the world’s total high seas catch, while Chile and Indonesia had the third and fourth largest catches, followed by Spain. Despite having the largest high seas catch by volume, fish from the high seas account for only 5% of China’s total domestic catch. Catch from the high seas contributed to ≤6% of the total national catch for half of the top 10 fleets: China, Japan, India, Indonesia, and the Philippines; only for Ecuador and Taiwan did high seas catches account for more than one-third of their domestic landings.

Current traceability standards do not allow disaggregation of imported seafood into spatial jurisdictions (that is, caught on the high seas versus in an EEZ). However, imports of species caught on the high seas are available, and Japan was the top importer of all three globally traded bluefins (93% for southern, 58% for Atlantic and Pacific), as well as bigeye (75%), and the secondary importer of yellowfin (20%) and both toothfishes (22%). Thailand was the top importer of skipjack (63%), yellowfin (21%), and albacore (30%), and Spain was the secondary importer of albacore (19%). The United States imported the majority of both toothfishes (48%) and all of the krill and was the secondary importer of southern bluefin (2%). With the exception of South Korea importing almost all of the globally exported chub mackerel and Pacific saury, all other primary importers of species caught on the high seas were from the European Union (EU) (for example, Denmark, France, Italy, Spain, and the Netherlands). Further details of these trade flows—and additional trade of affiliated processed products—are available in Fig. 2 

Fig. 2 Imports of species caught on the high seas.Solid arrow width proportional to destination’s share of total global imports for each species group (fresh, frozen, unprocessed form), and dashed arrows indicate likely form of consumption in primar…

Fig. 2 Imports of species caught on the high seas.

Solid arrow width proportional to destination’s share of total global imports for each species group (fresh, frozen, unprocessed form), and dashed arrows indicate likely form of consumption in primary importing country or, if applicable, processed product produced.

High seas fisheries contribute an estimated 4.3 million metric tons (2.4%) to the global seafood supply. In 2014, these fisheries were valued $7.6 billion, yet they are enabled by an estimated $4.2 billion in annual government subsidies (17).

Conclusions
The discussion of access to the high seas will inevitably lead to concerns about how closing areas to fishing could affect global food security. Here, we show that only one species of toothfish is caught exclusively on the high seas, that the high seas catch contributes less than 3% to the global seafood supply, and the vast majority of the marine life caught on the high seas is destined for upscale markets in food-secure countries. On the basis of the available data, high seas fisheries do not make a direct or crucial contribution to global food security.

----

I really like Megan and Laurenne's approach to a lot of their research, and hope to see more of them coming out (and hopefully participate on some).

Bunkering at sea, IUU Fishing and Social Network Analysis by Francisco Blaha

I remember as a kid learning maths and by some reason was fascinated by the concept of “common factor” and while this new paper does not deal with that concept itself, it did make sense to my little brain to see it from that perspective.

Not really a bunker... but you get the idea.

Not really a bunker... but you get the idea.

The biggest “conditioning factor" for the time a fishing vessel can fish is fuel. Even if efficiency has moved forwards a lot, there are substantial fuel users… According to an ISSF-commissioned study, the longliners burns roughly 1,070 litres of fuel to land one ton of tuna (in comparison a Purse Seiner burns 368 for the volume, but catches way more per set)

Furthermore, the bigger your fuel thanks the smaller the space for your fish (and at least if the vessels is EU approved, cannot use fish holds as fuel thanks as most vessels actually do), hence (as anything in fisheries) is all about compromises.

If vessels had to come back to port to refuel every time they run out, fishing as we know it would not exist (may be a good thing). In any case, the dependence of vessels to stay at sea for more than their autonomy based on the capacity of their fuel thanks is ONLY via bunkering (the supplying of fuel for use by ships) and this is a world on itself. A world many many people in fisheries (including me) don't really know a lot about. The ones I was involved always were a decision in between the skipper, the vessel manager on one side, and the captain of the bunker and its owners on the other. 

Bunkering it's a rather complex manoeuvring highly dependent on weather, ocean conditions and the respective sizes of both ships, the simplest scenario is illustrated here. But I can’t remember any of the ones I been involved with that dint involve at least some fuel spill... but that is another topic i like to study one day

Bunkering, is also solid business and there are big companies that deal with entire fleets and some smaller ones that are less transparent. Some, like this company, publish where their bunkers are in the Pacific and the world.

As transhipments in at sea, bunkering is regulated, but… While in principle all bunker need to be registered in the WCPFC record of fishing vessels, and then licensed to operate in the countries EEZ, and they have to be reported… not always the system is being followed.

And of course in the High Seas is the responsibility of the flag states, and as you imagine... bunkers tend to be flagged in developing countries with open registries and weak oversight. In fact, bunkers are as necessary to fishing as carriers, which at least tend to have an observer on board, as a fishing support vessel, something way more diffuse in bunkers.

I always had the idea that if were to investigate better the “common factors” approach in port agents, bunkers logistics, and captain networks / afficliations we could get a better understanding of the inside dynamics of the Pacific longlining fleet that is where we have the biggest impact of IUU in the region. But as one band man, not much chance to do research for the love of it and work as a consultant under well defined ToRs... so i keep those ideas packed in my brain and maybe one day i get paid the develop then!

And voila, here is a paper “Chasing the Fish Oil—Do Bunker Vessels Hold the Key to Fisheries Crime Networks?  that deals with that issues, yet it uses social network analysis (SNA) a more sophisticated approach that my basic “common factor” idea, and coincidentally I got to meet Jessica Helen Ford (the main author) a few weeks ago in Bangkok

Interestingly her background is not fisheries, but statistics and organisms movement, so she brings a totally fresh approach to this field… and I just love that, because it challenges you to think differently. Besides been VERY clever she is also really nice and a cool person. So I’m sure I will keep following her work. 

As usual, I recommend you read the original she wrote with other two colleagues from CSIRO in Australia, I just quote some of the things I found more interesting.

Abstract
Disentangling fleet activities, therefore, necessitates identifying and understanding how key players or actors function to support or guide IUU activities. In this regard, recent efforts have focused on identifying transshipment activities by finding and following refrigerated cargo (reefer) vessels. We suggest that bunker, or fuel vessels, may provide one solution to understanding and unravelling these IUU networks for two main reasons: they are fewer in number, are known to provide additional support to fishing vessels beyond refuelling. In this respect, bunker vessels are also used to resupply provisions, and crew, thereby facilitating human trafficking and slavery, which is demonstrably rife in certain components of the commercial fishing realm (e.g., long distance or high seas fleets). Here, we illustrate how social network analysis (SNA) could be used as a methodological lens to expose previously clandestine IUU fishing fleet dynamics. Specifically, we highlight the connectedness of a tanker vessel, and several fishing and reefer vessels, in an area in the Southern Indian Ocean that has high levels of fishing and general shipping.

Crime and Social Networks
A considerable amount of literature in criminology and social psychology illustrates the important role that socialization and the surrounding environment play in shaping people's behaviours. While an extensive literature review is beyond the scope of this current project, a key finding from these research domains is that people's behaviors are shaped by their social and natural environment and the people with whom they associate (e.g., Bandura and Walters, 1977Gordon et al., 2004Akers, 2009). Understanding the dynamics and mechanisms of information transfer in the social systems or networks that these criminals operate in is therefore vital and can be accomplished with social network analysis (SNA). Broadly, SNA aims to describe and explain the structural patterns and mechanisms that define social relationships between humans (Scott, 2017).

In brief, SNA shows how individuals are joined in a population using various metrics. These range from degree centrality, which counts the connectedness of a node given the number of connections, to more complex metrics such as eigenvector centrality, in which a node's importance is proportional to the centrality score of all its connections (for more information see Mbaru and Barnes, 2017).

Social network analysis has previously been used to understand natural resource governance (e.g., Bodin and Crona, 2009), including fisheries-related topics such as the success of co-management arrangements (Sandström et al., 2014Alexander et al., 2015), willingness of fishers to enforce sea tenure (Stevens et al., 2015), information diffusion among resource users (Pietri et al., 2009Mbaru and Barnes, 2017), and recently, to tie fishing practices to ecosystem health (Barnes et al., 2016).

Fuel resupply vessels (bunkers) have been acknowledged as an integral component of the infrastructure needed to maintain IUU fishing (Gianni and Simpson, 2005). However, we propose that the importance of bunker vessels has been underplayed to date, and increased effort should be focused on tracking and monitoring them. In comparison to reefer (refrigerated cargo) vessels, bunker vessels (although fewer in number) are likely more connected than reefer vessels. We propose that tracking their paths and movements should indicate zones of both legal and potential illegal fishing activity.

Here, we apply SNA to illustrate the dynamics, network position, and importance of bunker vessels in a fleet. Social network analysis is a valuable but seemingly unused tool for this type of investigation; it can provide a framework to infer associations and describe a social structure (Farine and Whitehead, 2015), in some cases allowing inference about vessels based on their associates and connections. We demonstrate how it can be applied to fishery fleet dynamics to understand the nature of the connections and the key players in a network.

An Example of Social Network Analysis
We examined social networks of vessels in a region of the southern Indian Ocean (bounded by Latitude S 25°-S 35° and Longitude E 80°-E 110°) characterized by extensive fishing activity and major shipping lanes transiting to and from Australia. We used 6 months of AIS data, from May to October 2016, in order to demonstrate our application of the methods discussed here. Automatic Identification System was originally developed and implemented for safety as an anti-collision tool and is mandated for all vessels 300GT and over, on international voyages, and all commercial passenger ships (International Maritime Organisation, 1974). There were 181 unique vessels with more than 100 registered AIS transmissions in the region, which included: 119 bulk/container/vehicle carriers, 45 fishing vessels, 11 oil/chemical/liquefied petroleum gas tankers, 4 reefers, and 2 research vessels.

We used iGraph package (Csardi and Nepusz, 2006) in R (R Core Team, 2016) to model an undirected and unweighted network. We considered each of the 181 unique vessel Maritime Mobile Service Identity to be a vertex, and edges were calculated assuming proximity (within 10 km) to other vessels on a given day.

An important point to note here is that we were using movement to infer a social network, so proximity, or potential rendezvous, were assumed to represent interactions, which we were then able to map. In this sense, we were constructing a social network from surveillance data, not from interaction with the actors. There are potential benefits to such an approach, in that it may avoid respondent bias, but also some limitations as it is an indirect measure of the social network. We note that we have used a proximity measure here, and any changes in the assumed connection of nodes will cause variation in results. In addition, due to the purpose and focus of this article, we keep all reference to particular vessels or flag states anonymous.

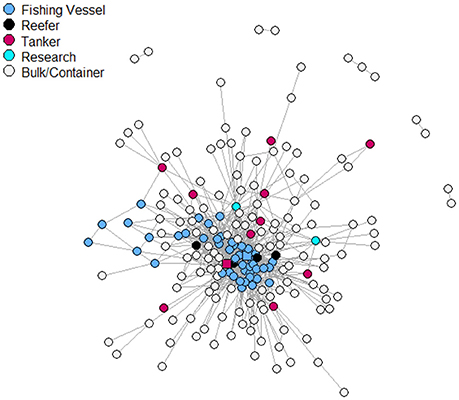
Figure 1. Network plot of all 181 vessels in the region. Most central node is indicated by a red square, and most central fishing vessel by a blue square.

Figure 1. Network plot of all 181 vessels in the region. Most central node is indicated by a red square, and most central fishing vessel by a blue square.

The SNA of vessels in the southern Indian Ocean (Figure 1) indicates several key players, and results point to several potential sub-networks. Importantly, across several measures (each of degree centrality, closeness, and eigenvector centrality), a tanker (bunker) vessel was ranked highest for each measure, followed by two fishing vessels (registered longliners). Most importantly in this context is the measure of eigenvector centrality, which is a combined measure of a vessel's importance, and the importance of all its connections in the network. For this measure, the top three ranked vessels were a tanker and two fishing vessels (both longliners). Given all 181 vessels, fishing vessels placed 35 out of the top 40 vessels. The other five vessels in the top 40 were the tanker (1st) and four reefer vessels.

How Are Social Networks Useful for IUU Fishing?
Given our findings that tanker vessels are central in a network of fishing vessels, we propose that they may serve as a useful indicator of fishing vessel activity. This is particularly relevant as fishing vessels are not required to transmit AIS (International Maritime Organisation, 1974), and often when operating outside the control of a Regional Fisheries Management Organisation or national government, they may not carry a vessel monitoring system, and so are effectively unmonitored. While surveillance data, such as satellite radar, may still identify them, this data is limited in availability and generally quite expensive. By contrast, bunkering and refrigerated cargo vessels are required to transmit AIS, and thus are more readily tracked (Metcalfe et al., 2018). However, it is important to note that there is the possibility for all vessels to switch off their AIS (Tetreault, 2005) and thus go unmonitored.

Figure 2. Tracks of four supply vessels noted to have had irregular behaviors. Gray dashed lines indicate extent of data for purposes of presentation. Inset box displays extent of data in larger region.

Figure 2. Tracks of four supply vessels noted to have had irregular behaviors. Gray dashed lines indicate extent of data for purposes of presentation. Inset box displays extent of data in larger region.

We show tracks of several support vessels (Figure 2), including bunkering and refrigerated cargo vessels, traversing the region between Papua New Guinea, Indonesia, Timor Leste, and Australia. Of note are the positions of these vessels off of the south coast of Timor Leste. These support vessels remained in this region for extended periods of time, despite the lack of any relevant infrastructure, and returned on numerous occasions. Sometime well after the authors initially noted this behavior, subsequent reports emerged that several large factory trawlers from China were operating in Timor Leste waters (IUUWatch, 2017). Although we are not aware of any actual link, we propose that this example is a key illustration for linking illegal networks with observed activities in an area—the irregular behavior of the bunker vessels was evident well before any knowledge of illegal fishing activity in the area.

Summary
Social networks have been used to study ecological interactions for varying populations. The application of SNA above demonstrates the applicability of the use of social networks in understanding and assisting in maritime domain awareness, and specifically as it is applied to fisheries monitoring.

A key advantage of such an approach is that the network highlights the key conduits of information. In the example we provided, a bunker vessel and several fishing vessels were frequently ranked at the top, regardless of which measure of centrality was used. This effectively highlights the importance of tracking supply vessels to uncover potential IUU activities. As previously noted, most of the focus to date has been on the role of reefer vessels in facilitating IUU activity (predominantly through transshipment). However, we propose that bunker vessels, which classify as support vessels and thus fall within the definition of IUU, are an important conduit within the IUU network.

The role of bunkers as a key conduit of information positions them to potentially hold information about illegal networks. It is also possible that bunker vessels, in their role of transshipment of provisions and crew, thereby facilitate human trafficking (Ewell et al., 2017). As such, resupply vessels are either knowingly, or inadvertently, supporting conditions conducive to slavery. Previous research has highlighted the role that insurance companies could play in combatting IUU fishing (i.e., withholding insurance for vessels known to engage in IUU, see Miller et al., 2016 and Soyer et al., 2017), an approach that may also be conducive to curtailing the role of supply vessels deemed to support IUU fishing activities.

----

As I wrote before, I totally welcome these type of papers. Yes, I know, there are limitations in the use of IAS for MCS. But the genie is out of the lamp, and while IAS is not new, only recently we had the computing capacity and funds available to tackle the mammoth task of analysing such vast amounts of data and mixing it with fresh approaches. And the effect is profoundly disrupting, even is just by bringing prior impossible transparency, new people and their differeent approach to intelligence into this area. 


FAD numbers and their tracking in the WCPO by Francisco Blaha

I never been to the meetings of the Science Committee of the WCPFC (the 14th one is happening in Busan, Korea at the present) yet I try to make time to read the papers presented (mostly by SPC) as they present the latest understanding of an incredible variety of aspects associated to the management of the world’s biggest fishery.

While by academic training I’m a fisheries biologist, after my thesis (identification of new reproductive stock of hake) I barely did anything related to stock assessments or the wider applied science field, as went back into fishing and operational work. Yet I get a kick from pushing myself to stay updated. 

Dont blame the tech... blame their missuse

Dont blame the tech... blame their missuse

Some of the papers are really dense reading and for the connoisseurs only, but most can be followed if you have a keen interest and know the basics… in any case one of my favourite topics if the one on FADs (and been writing for a while about them), and among the paper of this session there are two that brought home the staggering numbers we are dealing with, the technological advances in them, the impact they are having on the fishery and the challenges around their management (or lack of).

My brilliant colleagues at SPC author the papers “Estimates of the number of FADs active and FAD deployments per vessel in the WCPO” and “Report on analyses of the 2016/2018 PNA FAD tracking programme”, and if you are interested in FADs are compulsory reading.

I quote below the parts that impacted me the most. And then at the end, for whatever is worth, I rant a bit on my ideas for their management.

The first paper (estimates of FAD numbers) attempts to estimate the number of deployments and active FADs per vessel. Estimates were derived using two different approaches. Firstly, based on fishery data for 2011–2017, the number of deployments recorded in the observer data, the observer coverage by vessel, and a clustering of vessels based on their FAD fishing strategy were used to estimate the total number of buoy (and FAD) deployments per vessel and total in the WCPO. The number of deployments varied from 0 to 500 per vessel but few vessels (depending on the estimation method and year) deployed/redeployed more than 350 buoys per year. This corresponds to a total estimated number of deployments between 21,000 and 51,000 per year in the WCPO for the 2011–2014, but the numbers drop thereafter, likely due to delays in receiving observer data for recent years. 

IMG_9641-Edit-1.jpg

The second approach combined fishery data and the PNA FAD tracking data and therefore only covered 2016 and 2017 with precise estimates only possible for some vessels. The estimated number of deployments per vessel varied between 1 and 550 (mean = 129) in 2016 and 1 and 999 (mean = 226) in 2017 and the estimated number of active FADs per vessel varied between 1 and 454 (mean = 102) in 2016 and 1 and 955 (mean = 163) in 2017. At the scale of the WCPO, this corresponds to 30,700–56,900 deployments in 2016 and 44,700–64,900 in 2017; and 26,200–37,300 active FADs in 2016 and 38,000–48,200 in 2017. The ratio between number of deployments/redeployments per year and number of active FADs per vessel and per year average at 1.48. Less than 16% of the vessels were estimated to have more than 350 active FADs per year.

Yet the sentence I’ll remember the most is “The total number of deployments varied between 30,700 and 56,900 in 2016 (based on average and quantile 95%) and 44,700 and 64,900 in 2017”. One could be inclined to think that with so many FADs there are actually no free schools… but just schools swimming in between FADs.

To improve the ability of the Scientific Committee to estimate potential FAD levels, the collection of additional information is suggested. For example, to better understand the total number of FADs in the water, this could include the submission of i) the number of new FADs deployed per year per vessel; ii) the average daily or total number of active FADs per vessel per month; and iii) the number of deactivated FADs per month. The first could be derived from fishery data, if observers can record all FAD deployments or if captains start recording these data in a FAD logsheet. In order to obtain an estimate of the average daily or total number of active FADs per vessel these data could be derived from FAD tracking data. In parallel, to better study FAD density, aggregated summaries per 1° cell and month including number of buoys activated, number of buoys deactivated and number of FAD deployments could be considered.

Smoothed kernel density of deployments of buoys per 1° grid cell during 2017. Maximum number of deployments per cell is 300 in 2017.

Smoothed kernel density of deployments of buoys per 1° grid cell during 2017. Maximum number of deployments per cell is 300 in 2017.

The 2nd paper introduced me to the issue of geo-fenced buoy transmission on FADs by which the data received by PNA are modified by fishing companies prior to submission, for example, information outside PNA Exclusive Economic Zones (EEZs) may be removed presents analyses of the PNA’s fish aggregating device (FAD) tracking programme. Approximately 35% of the fishing companies were found to have geo-fenced more than 90% of their buoys. When buoys are geo-fenced it leads to gaps in the trajectories of a few days to 1 month, limiting the analyses performed on the data.

This very interesting report includes a description of the data processing required; estimated data submission rates to the PNA; a description of the spatio-temporal distribution of buoy deployments; FAD densities; FAD connectivity; and an analysis of the fate of FADs including a focus on FAD beaching. As FADs drift in the ocean, the associated electronics can be changed making it difficult to follow individual FADs, therefore for the purposes of this analysis we followed the satellite buoys unless otherwise stated. 

To better distinguish drifting buoys from those on board vessels, data were analysed using a Random Forest model to identify, and select, the drifting at-sea section of each buoy trajectory, and at the same time identify deployment positions. In addition, using two methods matching buoy tracks and observer or logsheet data, we estimated that ~60–70% of buoy transmissions collected by fishing companies are not forwarded to the PNA. We noted that some of the data received by PNA are modified by fishing companies prior to submission, for example information outside PNA Exclusive Economic Zones (EEZs) may be removed (i.e., “geo-fenced”), which added a bias to the analyses. After undertaking the correction procedure, the cleaned dataset consisted of 14.8 million transmissions from 26,466 buoys and covered the period from 1st January 2016 to 18th March 2018. 

usual image in most Purse Seiners I board. Satlink is the clear favourite brand

usual image in most Purse Seiners I board. Satlink is the clear favourite brand

The number of deployments varied over time, with a total of 36,831 deployments in 2016–2018 (from 193 vessels including 102 buoy owner vessels and an additional 91 vessels where the fishing company was known, but the buoy ownership was not). The spatial distribution of deployments was very similar between observer data and FAD tracking data, both showed the main deployments areas to be in Kiribati South of the Gilberts Islands and East of the Phoenix Islands, Nauru, East of PNG. 

The number of transmissions from buoys almost doubled in 2017 (8.6 million compared to 4.5 in 2016) and the number of individual buoys active in the available data was 10,915 in 2016 and 18,405 in 2017. A decrease in both numbers was detected during the FAD closure in 2016 and 2017, although in 2017, both remained relatively high and constant during the first 3 months of the closure. Although influenced by the issues arising due to geo-fencing, the spatial distribution of buoy densities were investigated, with higher densities in Kiribati South of the Gilbert Islands and around the Phoenix Islands, Tuvalu, PNG and the Solomon Islands. Buoys movement between large grouped areas of the WCPO was also investigated. Patterns varied between areas; for instance, the Southwestern area mostly received buoys from the East and had a high proportion remaining or being deactivated there, compared to the Southeastern area which showed high deployment and emigration rates. 

Not much biodegradable or non entangling in this FADs

Not much biodegradable or non entangling in this FADs

Finally, at least 5% of the buoys ended up beached (probably underestimated as buoys may be deactivated before reaching coastlines), with the connected FAD potentially damaging sensitive ecosystems such as coral reefs. At least 26% of the buoys in our dataset could be considered lost, likely leading to marine pollution.

My own thoughts?

At a personal level, I think the technology associated with the FAD (i.e. the buoys) is amazing, yet as any technology need to be assessed by their impacts. 

On one side the FAD/buoys can be (and are) set to drift across Marine Protected Areas, where they drag the fish (while being monitored from the vessel) which can meet them on the other side and set around them… so it would not surprise me that a lot of effort is now being done on the eastern boundaries of the Phoenix Islands Protected Area- PIPA.  Yet on the other side, one could see it as the potential of having 65000 echo sunders providing is with an unprecedented level of understanding of the stock status in the Pacific, because the information is being collected as we speak… yet that information is not shared with SPC

Hence from the management perspective, it brings a massive challenge, and the only way I see it can be managed is through licensing conditions and costs… stick and carrots approach

Through licensing by having a cap in the number per vessel, having the vessels registering the frequencies directly to the management organizations and linking pairs in between vessels and FAD buoys, and their sharing arrangements. Complex but not impossible, FIMS is doing something along this lines with the allocation and use of Vessel Days (VDS).

Furthermore, as many newer legislations include the possibility of enforcing laws over nationals of Flag states, the buoys provider mainly based in Spain, TW and China could be required to register their units sold frequencies with the regional bodies when that FAD Buoy is sold to a vessel fishing in certain area (as is the case with VMS units). When a set is done, the logbook and observers also record the FAD buoy ID in the forms. The rest is a matter of data management and tiding loose ends.

Then is the carrot, the more transparent the vessel, the more information shared is verified… the lesser the cost of each Vessel Day or other forms of licensing agreements. 


As a mostly operational consultant I’m not in the position to influence the management thinking… but I found that when you deal with fisherman (as I was) it pays to think like them. If you what to deal with them with only the bureaucratic approach, chance are you always going to be running behind the ball


Big Data meets Fisheries Geopolitics by Francisco Blaha

The fact the wealthy dominate any aspect of life should be a surprise to anyone in today’s world but is always good to see some numbers about it. Among the plethora of papers coming from the sudden availability and IAS data here is one that tackles how some nations (mostly without a lot of fish) dominate the catches worldwide by fishing in poorer countries with fish.

Is not the people that work in the ports and boats the ones making the money unfortunatelly

Is not the people that work in the ports and boats the ones making the money unfortunatelly

The paper just published by a group of researchers (mostly from UC Santa Barbara) is one of those that verify facts the one suspects, but at least in my case, I was staggered by the impact of some nations... and you should read the paper here. 

While we know that in the ABNJ (aka high seas) fishing effort is dominated (97%) by vessels flagged to higher-income nations, with less than 3% of effort attributed to vessels flagged to lower-income nations. I was really confronted by the fact that 84% of the industrial fishing effort in lower-income EEZs was conducted by foreign countries, with the majority of this industrial fishing effort (78%) from vessels flagged to high- and upper middle–income nations.

Most AIS-detectable industrial fishing effort that was observed within all EEZs was detected in the Pacific Ocean and the Atlantic Ocean (60 and 35% of total fishing effort observed in all EEZs respectively). Patterns were consistent across the 2 years studied with a nearly identical pattern as recorded in 2015.

The discussion (part of which I quote below) is eye opening;

The new view afforded from this open AIS-based analysis of global fishing activity reveals stark levels of unevenness with respect to wealth class for industrial fishing effort. Globally, 97% of all industrial fishing effort detectable using AIS (on the high seas and within EEZs) comes from vessels flagged to higher-income nations—or 23 million total hours of industrial fishing effort in 2016. This same pattern of dominance by higher-income nations repeats itself on the high seas, within the EEZs of higher-income nations, and within the EEZs of lower-income nations.
On the high seas, 97% of all such fishing effort detectable by AIS is conducted by vessels flagged to higher-income nations. Dominance of this high seas industrial fishing effort at the level of flag nation was highly uneven. 
The vast majority (86%) of this effort can be attributed to only five higher-income countries/entities, in rank order (China, Taiwan, Japan, South Korea, and Spain. When China and Taiwan are analyzed together, they account for approximately 52% of the industrial fishing effort we detected on the high seas, which, by reference, is an amount approximately 12 and 27 times greater than the high seas fishing effort detected for the United States and Russia (two other large nations), respectively. 
The only two lower-income nations that ranked among the top 20 nations with the highest amount of AIS detectable industrial fishing effort on the high seas were Vanuatu and Ukraine (both lower middle–income nations). Vanuatu is a nation with an open vessel registry (colloquially known as a “flag of convenience”) that has been reported to include many vessels owned and controlled by higher-income foreign nations (mostly TW and CN in my experience) (26). The majority of the Ukraine fleet is owned by the Ukrainian government.
Density distribution of global industrial fishing effort, derived using AIS data. (A) Vessels flagged to higher-income countries and (B) vessels flagged to lower-income countries.

Density distribution of global industrial fishing effort, derived using AIS data. (A) Vessels flagged to higher-income countries and (B) vessels flagged to lower-income countries.

Very similar dominance patterns were reported in our analysis of the world’s EEZs, where the majority of AIS-detectable industrial fishing effort within national waters was executed by vessels flagged to higher-income nations. We emphasize, however, that a strongly divergent pattern emerges from our analyses of fishing effort density within the EEZs of higher- and lower-income nations. The vast majority of AIS-detected fishing effort within the EEZs of higher-income countries came from their own fishing fleets. Nearly the inverse was true for lower-income nations, where foreign fishing vessels (mostly flagged to high- and upper middle–income countries) dominated the industrial fishing effort in their EEZs.
Most of the industrial fishing effort in lower-income EEZs was conducted by foreign countries, with the majority of this effort from vessels flagged to high- and upper middle–income nations. 
Globally, the three countries showing the greatest fishing activity in other nations’ EEZs were (from high to low) China, Taiwan, and South Korea. China and Taiwan together accounted for 44% of this global foreign fishing. We detected fishing effort from China alone in the marine waters of approximately 40% of all non-landlocked nations (n = 60 distinct EEZs). China, Taiwan, and South Korea (from high to low) also carried out the highest amounts of foreign fishing effort recorded globally in lower-income EEZs, or approximately 63% of all such effort detected
There are certainly exceptions to the bulk pattern of higher-income dominance of fishing effort in lower-income EEZs. In some lower-income nations, such as India, there was virtually no detectable higher-income fishing within their EEZs. These patterns may be explained in part by national legislation prohibiting or limiting foreign fishing within such EEZs, but could also result from joint fishing regimes occurring within these EEZs.
The patterns of industrial fishing effort within EEZs derived using these AIS-based techniques reinforce and extend conclusions drawn elsewhere using other methodologies and data sources. For example, analyses of fisheries production and trade data reveal a persistent trend whereby wealthy nations fish in the waters of less wealthy nations, but not vice versa (2829).
The relatively recent emergence of the capacity to track industrial fishing effort using AIS prevents examination of the history of this buildup. Elsewhere, however, it has been suggested that the ascendancy in dominance of more wealthy nations fishing within the waters of less wealthy nations (for example, Europe in Northwest Africa) has occurred within the last several decades (28).
Our analysis also does not differentiate between gear types used by industrial fishing vessels. Self-reporting of gear type in AIS data suggests that our pooled analysis of global industrial fishing is dominated numerically (that is, proportion of unique vessels) by trawlers, purse seiners, and longline vessels. Certainly different gear types fish in different ways, which may complicate our estimations of fishing effort made using fishing hours; for example, the extreme time efficiency of purse seiners setting rapidly upon fish aggregating devices is not comparable to more time-intensive fishing methods, such as longline fishing. To investigate the sensitivity of our conclusions to this choice of fishing hours as our currency of measure for fishing effort, we reanalyzed our data measuring fishing effort in the time currency of fishing days. Effort analyses made using fishing days did not change the direction or pattern of our major conclusions for the high seas or within national waters.

I really like their acknoledgement on the limitations of using AIS

We highlight here three major shortcomings of using AIS. First, international and national regulations for the use of AIS and enforcement of these regulations are insufficient in many parts of the high seas and in many EEZs. Many countries adhere to IMO requirements on AIS usage; however, the specifics by which these regulations are codified into national law vary widely, with examples of strict and lax regulation found among both higher- and lower-income nations (9). Second, industrial fishing vessels in lower-income nations may be less likely to carry and use AIS for reasons unrelated to AIS policy. We note that we detected fewer vessels using AIS than are represented on FAO vessel registries and that there is less AIS visibility for vessels registered to lower-income nations. There are a variety of explanations for these discrepancies. For example, some vessels listed by the FAO may have been inactive during our study or regional officials may have overreported fleet sizes to emphasize local growth. By using VMS data derived from Indonesia, we were able to conservatively estimate upper bound corrections for AIS underreporting in lower-income nations. This correction, however, only increases the global contribution of lower-income fishing on the high seas by approximately 6% and within the EEZs of lower-income nations by 29%. A third potential weakness of AIS stems from reliance on a vessel’s reported maritime identification digits (MID) to identify flag state. These MID are typically self-reported and may be entered incorrectly. This also relates to the larger, well-known problem of flag states not always corresponding to the state of vessel control or owner residence [rates estimated at 22.4% based on one analysis (26)], as many vessels operate with flags of convenience to take advantage of lower operational costs, less regulation, and reduced tax liability (2634).
Consequently, many vessels that we class in this analysis as flagged to lower middle– or low-income nations may actually have economic ties that are more closely aligned with higher-income nations. A related important nuance not treated in our analysis is that we do not track the actual firms or companies that own or fund the vessels observed through AIS, despite the influence that these firms have over vessel behaviour.
Collectively, some of these uncertainties and potential biases inherent to AIS data may act to overestimate fishing effort from higher-income nations (for example, reduced visibility of smaller vessels from lower-income nations), and some may act to underestimate higher-income nation fishing effort (for example, a large number of vessels originating from higher-income nations flagged to lower-income nations known as flags of convenience).
Our general conclusion that vessels flagged to higher-income nations dominate industrial fishing on the high seas and within EEZs largely persisted when we aggregated effort by day instead of fishing hour , retested our conclusions using a smaller size threshold (that is, >12 m) for defining industrial fishing vessels (fig. S6), and added a VMS-informed correction for undetected fishing effort in lower-income nations. Nevertheless, responsible interpretation of the new patterns we report using AIS requires direct consideration of all the aforementioned potential weaknesses and uncertainties.

And a polite foray into the reality of Fisheries Colonialism!

On one side, many researchers and managers have expressed unease concerning the potential vulnerabilities that may be created by concentrating dominance over fisheries in the hands of a few wealthy nations. These groups sometimes refer to this skew in control over marine resources as “ocean grabbing” or “marine colonialism” and connect the potential risks involved to those often associated with the practices of land or resource grabbing that occurs when wealthy foreign nations or foreign companies take control of terrestrial or agricultural resources or infrastructure in less-wealthy nations (36)
Significant concern has also been raised about how corruption in some lower-income nations may facilitate misuse of fisheries access payments that prevent such cash from constructively aiding health, development, and growth goals of these nations (171921). Policy options for meeting rising demand for fish in the Pacific region include actions such as diverting some of the tuna currently exported (and captured mostly by foreign fishing vessels) onto domestic markets of lower-income states (39). Another possible opportunity for intervention for stakeholders concerned about foreign dominance of industrial fishing in their national waters derives from the open nature of the data we report and the transparency it fosters.
Access to these publicly accessible data feeds creates opportunities for all citizens in lower-income nations to put meaningful questions to their local leaders regarding sanctioned and unsanctioned foreign industrial fishing in their home waters.
Others have argued that allowing higher-income nations to dominate fisheries presents a desirable and efficient pathway for developing nations to turn their natural capital (for example, fish resources) into financial capital (for example, access fees, license fees, taxes, foreign exchange earnings). Building up a domestic industrial fishing fleet, maintaining it, and servicing it require port infrastructure, a trained workforce, processing and handling capacity, and considerable financial capital—all of which can be challenging to mobilize or lacking in many fish-rich lower-income countries.
Kiribati provides an example of a country where arguments have been made for the efficiency of translating fish into cash. Kiribati is a lower middle–income nation for which we determined that 99% of the industrial fishing effort within its EEZs was delivered by foreign flagged vessels, with the majority of this effort (91%) coming from higher-income nations. Kiribati reported generating 121.8 million USD in 2016 by selling access to fishing rights in its EEZs, with similarly substantial revenues collected in surrounding years (3940). Generally, it is not entirely clear that allowing industrial fisheries from wealthier countries to dominate offshore fisheries within less-wealthy nations’ EEZs always has negative food security impacts. 
The efficiencies of industrialized fisheries allow them to put large quantities of lower-cost fish onto the global market, and this results in a net import of lower-priced processed fish from wealthier nations to poorer nations that, in terms of overall per-capita supply, may help counterbalance the net movement of higher-priced fish from poorer to richer countries (3541).
The capacity to view and analyze large portions of publicly accessible data that reveal how the world divides up a major global resource, like marine fish, is unique. Analogous sources of detailed insight are not, unfortunately, available for other environmentally, socially, and economically important large transnational resource harvest domains, such as logging or mining.
The results presented in this analysis represent data-driven hypotheses surrounding distributions of industrial fishing effort that can be thoughtfully considered during the ongoing high seas biodiversity treaty proceedings at the United Nations and by regional fishing management organizations. This information can help these leaders more effectively pursue shared goals for maximizing equity, food security, and sustainability on the high seas in the near future. These patterns also help to clearly identify which states may stand to win or lose from alterations to the current order of high seas biodiversity management and highlight how the hegemonic powers in high seas fishing can constructively assume more responsibility in leading toward this improved future.
Observations of the apparent dominance of wealthy foreign nations in the EEZs of less-wealthy nations can similarly empower and inspire both citizens and leaders in these regions to have more constructive discussion about best pathways toward securing sustainable and equitable futures for their domestic fisheries. These data also provide an improved understanding of the scope for potential competition between foreign industrial fleets flagged to wealthy nations and domestic small-scale fisheries—competition that is known to create numerous challenges for affected small-scale fisheries and the stakeholder communities linked to these fisheries (6742).
The extent and lopsided nature of the dominance of higher-income flag states in industrial fishing can and should also inform ongoing conversations about how fisheries subsidies reform can potentially curb socioecological abuses associated with distant water fishing (25). Addressing all of these issues is a time-sensitive matter. Significant stresses are likely to be placed very soon upon the food future and political stability of many of the marine regions where we highlight greatest levels of imbalance in regimes of industrial fishing (35).

A five-point "Labour Safe Screen" in seafood supply chains by Francisco Blaha

As may be obvious, I like reading some published papers about fisheries and in particular those from people I know and like. A couple of days ago my colleage and friend Katrina Nakamura as lead author of an interesting group that included other two people I know, Ganapathiraju Pramod and Dominic Chakra Thomson, published a very good paper in the hot topic of labour abuses in the seafood industry.

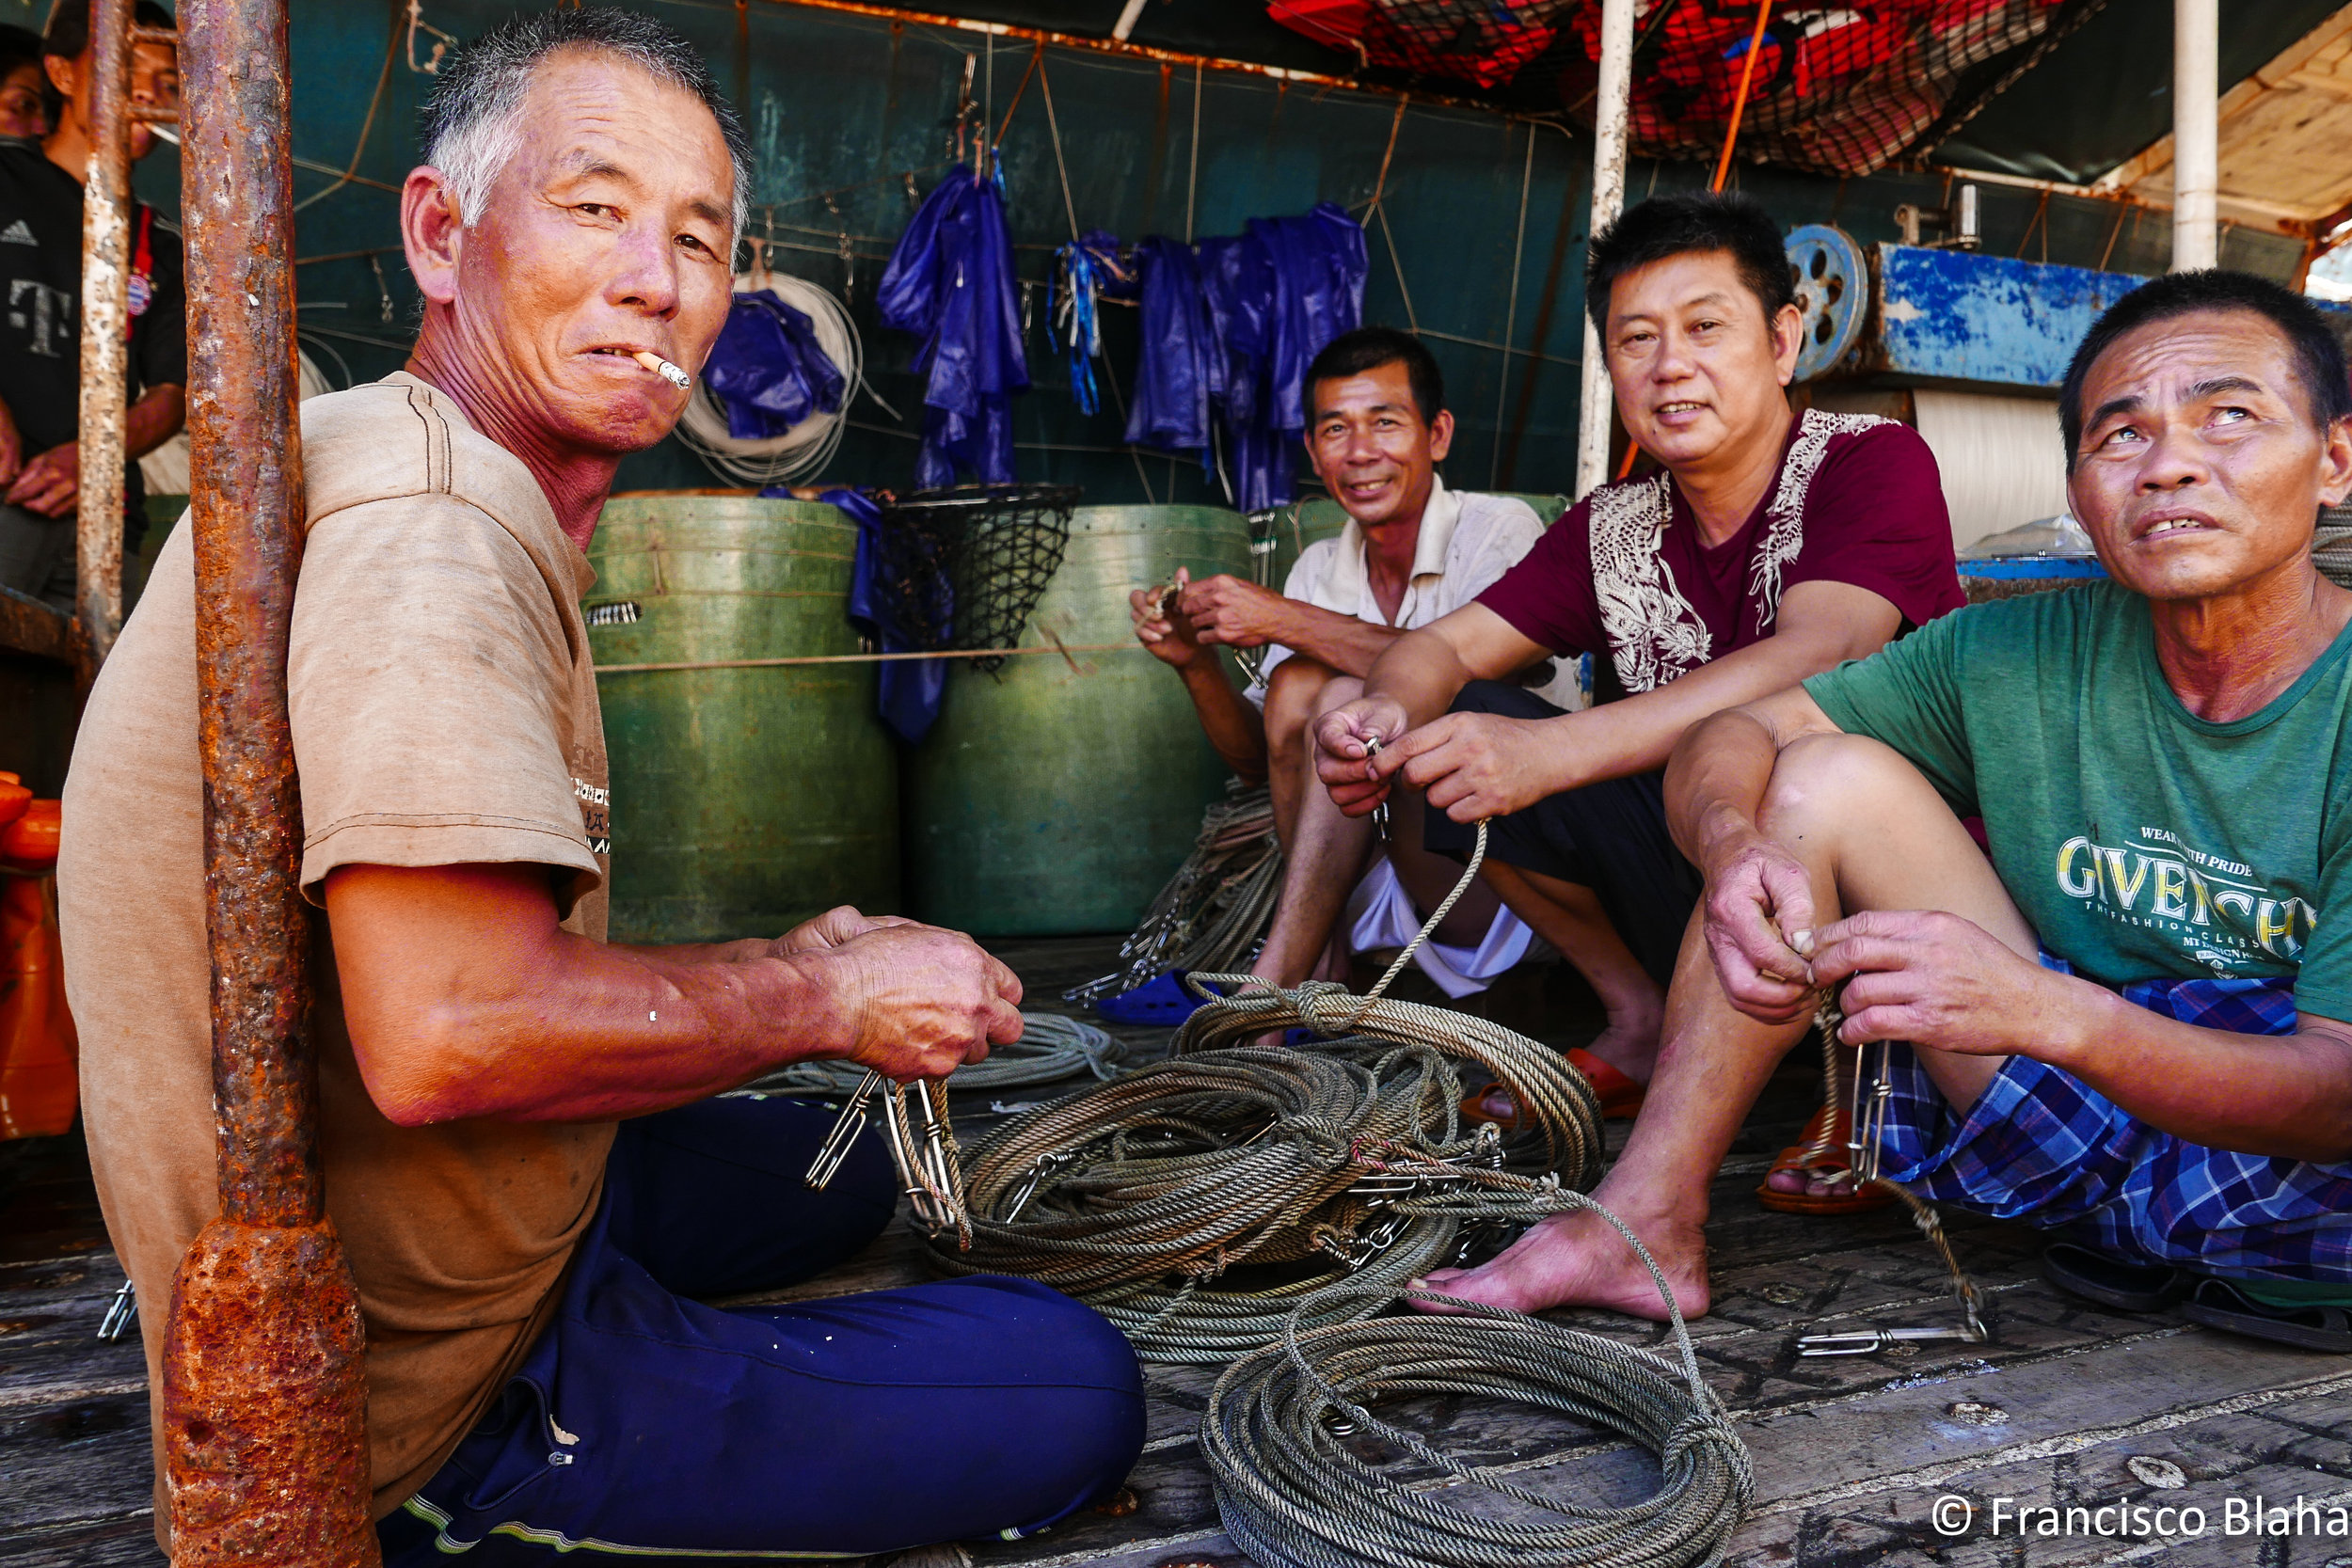
Crew of chinese longliner

Crew of chinese longliner

As an ex-fisherman, I have written that for me the real “race to the bottom” has been on the crewing side and the relation to forced labour. I don't think that a complicated 18-year-old kid like I was at the time could use fishing today to get through life and pay for its studies. Yet when I came to NZ I was surprised how much better life was on board, and how much more money I got paid (and on time!) we had here in comparison to Argentina and the Pacific Islands where I worked before coming here.

So where you stand and what you are used to makes big difference in this area, so where is the line that separates what is acceptable? And that is what I like the most of this paper, it has, in my opinion, a fresh an balanced approach that gets away from the “developed country saviour” stereotype that other initiatives in the area seem to have.

When I read :

We shifted the basis of screening from attempting to prove or to disprove forced labour conditions in supply chains toward establishing system fundamentals for human rights due diligence.

I was convinced that this is the way to follow, and this paper is one of those that we will see quoted many times! So read the original! I just quote some parts of the original and from this presentation of results here.

Is a complex topic with a lot of regional variabilities. There used to be a good correlation in between the flag of a vessel and the nationality of its crew, in many cases, there was unions or syndicates that, provided boarding rights and negotiated standards conditions, but that is mostly gone.

Today in international fishing particularly by DWFN or by nationals of those nations flagging in developing countries, is labour brokers that's supply a mix of a professional crew from seafaring nations as well as less-skilled and lower-cost crew from quite desperate nations many of them without seafaring experience. The vessels are physically isolated, with working hours determined by ocean conditions and the round-the-clock duties needed to keep a ship operating safely. Payment for work is often a share of the catch value, based on seniority.

The less-skilled crew, who may not speak their colleagues’ language or have any legal standing in the vessel’s flag state, are vulnerable to involuntary and unpaid work. This is particularly the case where the direct employer is a distant labour agent, rather than the vessel’s owner.

Nonetheless, vulnerable conditions alone do not dictate forced labour. Fishing wages provide dignified livelihoods and an escape from poverty for millions of fishers and crew operating in many remote fisheries. But there should be a framework to see when the line is crossed.

And that framework is what this paper proposes, in view that given the complex international nature of seafood trade, private companies have an important role to play alongside national regulations. 

Hence they developed a five-point Labour Safe Screen (and tested it for 118 products). Four of these components are designed to identify the risk of slavery: 

  • product screening for country-level origins and standing on forced labour in seafood
  • a template for mapping the supply chain
  • an algorithm for estimating risk in fishing operations
  • surveys for collecting proof of protective conditions in the workplace.
  • The fifth component is a set of principles for minimum protective conditions in the workplace. 
Field-tested principles for minimum conditions to protect workers from forced labor.

Field-tested principles for minimum conditions to protect workers from forced labor.

The framework combined the use of technology in existing platforms with the collection of industry data and authoritative human rights data. Eighteen food companies used three or more components of the framework and systematically documented their supply chains, engaged suppliers, and cross-checked results. The companies were able to identify areas where working conditions met minimum principles, were unknown, or were inadequate.

Not surprisingly, they found that a data gap separates the industry and human rights sphere. Slavery in seafood was described as a tenacious and prevalent problem in Southeast Asia and international fishing fleets, based on our 12 interviews with human trafficking experts at the beginning of the study period in 2013. By contrast, slavery in seafood was described as an isolated and aberrant problem in eight interviews with senior seafood executives in the United Kingdom, United States, Australia, and Thailand in 2013. The human trafficking experts had gathered significant evidence of forced labour in seafood. However, their organizations had only limited relationships with the seafood industry at that time, limiting their access to data and avenues to effect change. The seafood companies gathered evidence to comply with legal and customs requirements and had limited access to worker data, human rights findings, and avenues to effect change. The data available suggest that the working conditions that allow for forced labour are nuanced, and risk identification requires firsthand worker perspectives (. Any interpretation of forced labour conditions is influenced by language and trust, and any preconceived notions about what a victim of forced labour looks like and how a victim behaves can aggravate consequences for human beings. To collect worker data effectively, both the industry and human rights spheres needed new relationships and methods.

Summary of results
Overall, the 18 food companies in our study used three or more components of the five-point LSS framework and systematically documented their supply chains, engaged suppliers, and cross-checked results. They experienced successes and challenges in trying to collect and verify data in their supply chains, which we have illustrated with examples and details (based on public data and excluding proprietary data). Human rights due diligence was a new concept to the seafood sector in the study period. The methods that worked well were supply chain mapping (component 2) and using supplier and human rights data together (component 4). These were indispensable for seeing previously unknown and at-risk conditions in the supply chain, for example, where brokers are predominant. It was challenging to collect data on working conditions from suppliers with online surveys (component 4). Respondents wanted to comply with their buyers’ requests but were concerned about losing business. The surveys were revised in 2016/2017 in part to de-risk the experience for suppliers and in part to improve the surveys in ways human rights authorities recognize to be legitimate. In the digital program, we found that suppliers did not maintain the labour code of conduct, universal contract, and grievance mechanisms the survey asked for but were familiar with local labour laws and social certification programs. We added an open question to collect all labour diligence efforts and avoid duplication and prescription. In Hawaii, we learned that remediation takes time and community engagement. The chain of custody documents (component 5) were revised in multiple rounds of stakeholder input and field testing to make sense to industrial fishing and seafood employers and to include specific references to the normative framework, for example, the C188 Work in Fishing Convention.
Slavery in seafood supply chains is an incendiary topic, and our intermediate goal was to resolve the finest possible scale of drivers and impacts from trade data and the factual accounts of workers and employers, and their representatives. We observed the drivers of working conditions in 118 supply chains, as well as the large-scale drivers of weak enforcement of labour and fisheries regulations and weak tracking of seafood product origins by companies and customs agencies worldwide. Forced labour in seafood coexists with overfishing, illegal fishing, corruption, and sex trafficking to service fishing fleets—a widespread problem documented by the U.S. Department of State. 
We are contributing interdisciplinary methods that we hope future researchers will use in service of decent work and labour safety in seafood. We learned that seafood companies want their vendors to have systems to identify risks and make improvements and to disclose their efforts. Companies said they wanted each entity in the supply chain producing the good before it reaches them to be responsible for protective working conditions in their operations. They wanted an onramp for the sector, and some wanted a seat at the table for the overall direction of the effort in the sector to ensure that it meets best practice, and particularly that it meets the highest-order legal tests from customs officials. Human rights authorities did not want the work done by companies to be token. They expected companies to use knowledge and resources in the human rights sphere, to act on the findings from workers, and to make their efforts available for verification. The company executives and human rights experts who contributed to our study expected certification programs for seafood sustainability to incorporate human rights due diligence.

Their proposal found that by triangulating industry and human rights data (from proprietary and public data sources), our framework allowed traders to identify the “pinch” points in their supply lines. They could then pinpoint labour risks where corrective actions could be most efficiently focused.

This approach captures data for each workplace as a product moves through the supply chain, transcending national domains and trans-shipping issues. 

The results give traders the tools to identify areas where working conditions are either acceptable, unknown or inadequate. 

Although risk-based due diligence does not guarantee that a product is free from forced labour, it does allow screening of large numbers of products. It can also focus attention on the most urgent points for remedial steps. 

Ultimately, regulatory oversight is the main ingredient for low risk and makes it easier to focus on minimum protective work conditions. So in situations where the regulatory systems are strict and enforced (as in Australia), then minimum standards are likely to prevail and forced labour is likely to be a low risk.

Ideally, robust risk assessment should be part of a multi-pronged strategy for sustainable and socially responsible seafood. As part of this, we should always include ways to hear directly from workers and their organisations at the front line.

Big Data meets Transhipments at Sea by Francisco Blaha

Transhipments (the unloading of all or any of the fish on board a fishing vessel to another vessel at sea or in port) per se are an integral part of fisheries, particularly of those involving DWFN (Distant Water Fishing Nations). As an example, it would be economically ruinous for a Taiwanese or Chinese FV to get back to their home port to unload, hence the practice to transship. Even for vessels flagged in the Pacific, as it seems to be the case, particularly when the beneficial owners are nationals of these DWFN (i.e. Kiribati vessels tranship in Tuvalu, PNG in FSM and Marshalls, Solomons in Marshalls, etc)

Global patterns of transshipment for different fishing gears

Global patterns of transshipment for different fishing gears

Transhipments in port areas, are easier to manage and control, and I have been working on this a lot over the years (a bit of a speciality actually), but the ones at sea are the problem. And this is being highlighted in two papers very recent papers: “Identifying Global Patterns of Transhipment Behaviour” and “Global hot spots of transhipment of fish catch at sea” and I recommend you read both!

I correspond with Nathan Miller (one of the authors on both papers on transhipment logistics), but I was very interested to see that Boris Worm, that back in 2006 predicted that there would be a global collapse of fish species for 2048, but since them he adopted less dramatic and better-studied views.

Both papers are quite illuminating, but before we dig deeper into them, let me explain a few things.

Transhipment is regulated at the regional, sub-regional, and national level in the WCPFC.  The sub-regional level is represented by a prohibition on at sea transhipment adopted first by the Parties to the Nauru Agreement (PNA) and subsequently by the Pacific Islands Forum Fisheries Agency (FFA). At the national level, Pacific island FFA member countries (PICs) control various aspects of transshipping using licensing conditions as well as regulatory instruments.

For Purse Seiners the ban of transhipment at sea in the FFA membership are well enforced, for longliners there are some exemptions, and those are then arguably controlled, but is never easy… 

But when we get to the High Seas (or better named Areas Beyond National Jurisdiction – ABNJ) it used to be VERY complicated because of the issues around jurisdictions. As soon as both vessels are in ABNJ all elements of Monitoring, Control and Surveillance head back to the tenuous concept of Flag State responsibility.

And here we have two potential scenarios that converge in one; either a) the Flag State doesn’t really give a shit for many economic/political reasons (i.e. many of the DWFN), or b) they can’t / have other priorities ( i.e. developing countries with “Open Registries” – FoCs, that do not have MCS capacities in function of their fleet size and distribution, the registry is offshore based, and does not respond to the government, etc.) and these weak flag states are predominantly used by nationals of DWFN to flag even more vessels… so basically neither side gives a shit.

Ideally, when a transhipment at sea is to occur, the fishing vessel is to request authorisation of its flag state (if the flag state was to allow them) based on a series of conditions being met, information provided, vessel VMS track being analysed, etc. (similar to what an authorization to use port should entitle), at the same time the master of the carrier (the vessel receiving the fish), should not receive the fish without the authorization of its flag state and details of the authorisation from the fishing vessel, today’s technologies allow for that. And of course, the presence of an observer or at least of EM (cameras on board) should be mandatory. (Needless to say, the port state where that vessel would unload should refuse landings if all this info, is not provided prior arrival, or even better under a eCDS).

Why does this don't happen? Well because the las of political will of the DWFN to play a part in the RFMOs that have jurisdiction over the ABNJ under their mandate. If an RFMO mandates the explained sequence of events under substantial scrutiny and an eCDS, then it has to happen. At present does not and when you find something, the legal framework becomes very difficult. 

I remember the case a few years ago in the Solomon Islands when a licensed TW longliner was discovered transhipping on the high seas. Yet, the attempt to prosecute the vessel for a breach of its fishing license was frustrated when the government’s legal advice realise that had no extra-territorial powers that would enable such a prosecution. 

The figure below from the "Global Patterns" papers on Flag Pairings, makes total sense to me. We know that in the region Taiwan uses Panama and Vanuatu as flags of convenience and that Korea uses Kiribati, the pairing proves that.

Flag pairings for fishing and transshipment vessels involved in encounters, for the fishing vessel flags with greatest number of encounters. Russian- and US-flagged fishing vessels predominantly associate with common-flagged transshipment vessels, w…

Flag pairings for fishing and transshipment vessels involved in encounters, for the fishing vessel flags with greatest number of encounters. Russian- and US-flagged fishing vessels predominantly associate with common-flagged transshipment vessels, whereas Asian-flagged fishing vessels associate with diversely flagged transshipment vessels. Values identify number of events involving each flag pair.

Hence, against the present situation, I totally welcome these type of papers. Yes, I know, there are limitations in the use of IAS for MCS (something the authors acknowledge and I wrote about before). But the genie is out of the lamp, and while IAS is not new, only recently we had the computing capacity and funds available to tackle the mammoth task of analysing such vast amounts of data. And the effect is profoundly disrupting, even is just by bringing prior impossible transparency to this area. 

Just as an example, I remember last year I got blocked out of my access to VMS and needed to find which vessels were in Majuro for my work there while I was off-island, I just went to GFW from my son’s computer, and that was it, I had all the vessels unloading there. It was a big eye-opener for me, the whole secrecy, confidentiality and all that type of reasons that industry and some nations have around the proprietary nature of VMS is gone through the window. Even now, when I want to see the track of a vessel from a flag state that no share its VMS track in the region, I just open another window on my browser and that it… the fact that I cannot use that data for building prosecution is almost irrelevant to me… that vessel is not invisible anymore.

The papers itself are good reading, and the primary value for me is that they verify things that I knew without haven being able to quantify them so far, and also found out some new stuff.  But mostly because they are a window to the “power” behind the computational capabilities of these guys. Yes, I found out some details and assumptions that I may look at differently… but I’m a deep believer in “don't let the perfect, get on the way of the good”. Perhaps be good for the authors to have a fisherman or sector specialist as co-author or at least as per reviewer, but that is all.

But when I read this papers, my mind wander into thinking on how much could be gained if the AIS data houses (in this case SkyTruth, but also OceanMid/Catapult) could have a detailed MoU with the RFMOs and the regional organization if work with (FFA/SPC), where not only data sources, but overall computing capacity and intelligence analysis could be shared. I imagine many of the algorithms being developed in these papers, mining the datasets managed by the WCPFC via FFA and SPC, results could be amazing… and even if you could not force the DWFN to act upon many of the cases found, “name and shame” would do a slow work towards the gradual strengthening of the legal obligations around the transhipments at sea practices until eventually, a strong system is adopted (and hopefully an RFMO wide eCDS)

I have adviced Nathan and Brad (from OceanMid/Catapult), as well as my bosses in the regional organisations to approach each other for collaboration. Yes, of course, the fact that one side governmentally managed and the other is private/NGO type does not make things easy, but in my humble opinion, there is a lot to be gained for both sides… 

I love to combine both datasets, to go deeper in the 1st fishing gears shown in the figure below and identify not only the "serial vessels" but the pairing patterns and the skippers involved. 

Spatial patterns of landed versus transshipped fishing effort. (from the Global Hot Spots paper)

Spatial patterns of landed versus transshipped fishing effort. (from the Global Hot Spots paper)

But then I’m just an ex-fisherman with a laptop, I don't have any influnece as an independet advisor... is just that I would love to be more involved with these tools, and be able to "mine" the data sets available at the regional organisations

The SALT DataLab in Bangkok by Francisco Blaha

Been to a lot of workshops and meetings on traceability, but none like the one I been involved over the last two days here in Bangkok with the good people of FishWise under the SALT (The Seafood Alliance for Legality and Traceability) Initiative. To the point that they call it a DataLab instead of a workshop.

presentations as I never seen before... who you are and where do you fit in the big picture (literally!)&nbsp;

presentations as I never seen before... who you are and where do you fit in the big picture (literally!) 

I wrote before about FishWise and SALT, but in a nutshell, SALT is a global alliance for knowledge exchange and action to promote legal and sustainable fisheries through improved transparency in seafood supply chains. 

They bring together the seafood industry, governments and nongovernmental organizations (NGOs) to accelerate learning and support collaboration on innovative solutions for legal and sustainable seafood, with a particular focus on traceability, the ability to track the movement of seafood through supply chains. 

The overall purpose of SALT is to realize improvements in fisheries sustainability and marine biodiversity through enhanced traceability and transparency that enables and incentivizes stronger fisheries management and increased industry self-regulation.

SALT Goals

  1. Expand accessible, interoperable and electronic catch documentation and traceability for wild capture fisheries and aquaculture.
  2. Increase the capacity of seafood-producing countries to adopt catch documentation and traceability systems to strengthen fishery management and verify fisheries data.
  3. Increase incentives and capacities for the seafood industry to adopt electronic traceability to ensure the legality of wild-caught fisheries products in their supply chains.
  4. Identify ways in which the implementation of electronic catch documentation and traceability can support human and labour rights for all seafood workers, food security, livelihoods and well-being.

Vision
At the end of this five-year project, SALT envisions a landscape with an empowered private sector that is able to meet its sustainability commitments by leveraging traceability and take action against the trade in illegal, unreported, and unregulated fishing (IUUF) products and those associated with human rights and labour abuses. SALT will support efforts to transform how the seafood industry and governments collect, share, verify, and utilize data, in the pursuit of sustainable fisheries and biodiversity conservation.

This workshop, or “DataLab," was set up as a knowledge-sharing meeting to promote learning around traceability and illegal, unregulated and unreported fishing worldwide. 

These are issues most of the people there already work on, but the idea to have this call for broader access to people and ideas to solve particular aspects of the problem is a good one. 

At the DataLab, everyone got the chance to engage with other seafood experts one don’t typically access every day, such as those in industry, technology, regulation, finance, government, and human rights. Gathering knowledgeable and influential minds in one room enables productive conversations, and they welcomed wide expertise and perspective.

The purpose of this particular DataLab was to convene influential stakeholders from Asia with diverse perspectives on issues related to seafood traceability, seafood legality, and fishery management. Identify and prioritize specific transparency-related problems and associated knowledge gaps that require collaboration to solve.

The outcomes expected were to

  • Form relationships among influential stakeholders from government, industry, NGOs, and other organizations
  •  Understand and identify opportunities for creating shared value
  • Identify a set of common knowledge gaps and problems to solve through collaboration
  • Build social capital and increase the willingness of participants to take action
  • Prepare participants to explain SALT and the value of SALT to their organizations

I feel that they nailed it, I was quite surprised by the wide field of people and how many people I got to see again as it has been a while since I worked in Asia other than Thailand.

The key value I got was not only on the outcomes (some of them confirmed issues I suspected already, while others were more novel) but on the process; this is the 1st workshop that I been that involved facilitation by facilitation professionals that are not people that work in the topic. While strange initially, the fact that they stick to a plan an are “inert” to the technical components (i.e. have no direct interest in the technical outcome) was really refreshing nd conducent top results.

Unfortunately, we could not have a wide presence form the Pacific (4 only but very good ones) due to a mixture of unfortunate late dropouts and visa problems…

Charlyn (front left) and Saurara (bottom left) did an awesome Pacific representation...&nbsp;knowledgeable and hard working.

Charlyn (front left) and Saurara (bottom left) did an awesome Pacific representation... knowledgeable and hard working.

But we got they thinking about organizing one for the Pacific since it is the “source” of a lot of Industrially caught fish processed in Asia comes from the Pacific, yet our situation for small scale is very different (very small value chain). 

SALT in progress

SALT in progress

I personally think that an event like this one in the Pacific (in Fiji perhaps) could be great for the region since our approaches for working in between traceability for sanitary and IUU are much more aligned than in Asia, but not so much in terms of labour issues. So I committed to promoting this idea among the regional organizations I work with.

As soon as the outcomes of the DataLab are out, I’ll post it here. 


Predicting global tuna vulnerabilities with spatial, economic, biological and climatic considerations by Francisco Blaha

I have reported in the past on excellent paper co-authored by my colleague Alex Tidd, obviously, he is on a roll. Last week, a new paper by him as the lead author was published and again is very good.

Model skill and cross-validation from the ridge regression analysis. (a) Pearson’s Correlation between feature variables, the plot uses clustering and the closer the variables are to each other the higher the relationship. While the opposite is true…

Model skill and cross-validation from the ridge regression analysis. (a) Pearson’s Correlation between feature variables, the plot uses clustering and the closer the variables are to each other the higher the relationship. While the opposite is true for widely spaced variables. The colour and thickness of the line represents the direction of the relationship and the strength.

I admire how people like him face an absurd amount of raw data, starts working ideas out, sits in front of a couple of screens and do R wizardry to do papers like this… relating fisheries to human development index (HDI) may sound bold, but makes total sense to me.

Tehre is the a subtantial lack of use of socio-economic data used by Tuna RFMO. Of course operational data may be hard to get access to but there is a lot of data out there that could be used to move beyond 1st base, as it is proven by this paper

For example some of the tuna RFMOs are starting to conduct Management Strategy Evaluations MSE’s on mixed fisheries, this requires identifying winners and losers.

Ironically in the tuna RFMOs when they do biological stock assessments they mainly use fisheries dependent data, but then the say we can not get the data to conduct social and economic analyses. If we can use fleet data to describe the biology  then surely we can use it to model the fishery as well.

Is obviously not light reading and some of the graphs are in a “format” I have never seen before (as the one above) and that is a good thing! But what I like the most is not just the questions that answers but the fact that set up a framework for many more unmade yet questions that clever people like him will answer.

As usual, read the original! I will here only quote the abstract conclusion and a section I found very interesting in fuel consumption.

Abstract
Overfishing impacts the three pillars of sustainability: social, ecological and economic. Tuna represent a significant part of the global seafood market with an annual value exceeding USD$42B and are vulnerable to overfishing. Our understanding of how social and economic drivers contribute to overexploitation is not well developed. We address this problem by integrating social, ecological and economic indicators to help predict changes in exploitation status, namely fishing mortality relative to the level that would support the maximum sustainable yield (F/FMSY). To do this we examined F/FMSY for 23 stocks exploited by more than 80 states across the world’s oceans. Low-HDI countries were most at risk of overexploitation of the tuna stocks we examined and increases in economic and social development were not always associated with improved stock status. In the short-term frozen price was a dominant predictor of F/FMSY providing a positive link between the market dynamics and the quantity of fish landed. Given the dependence on seafood in low-income regions, improved measures to safeguard against fisheries overexploitation in the face of global change and uncertainty are needed.

Over the last two decades there have been significant changes in fuel costs, fish prices, global warming, technological change (i.e. introduction of gears such as Fish Aggregation Devices, FADs), and changes in adult tuna stock biomass. All of these factors have a cumulative effect on the operating costs of fleets and thus their spatial behaviour. For tuna stocks, past exploitation levels and management measures have shown to be as important as the links between life history, market price and vulnerability to overexploitation. Although a composite index of fisheries management at the country-level has shown to be positively related to factors such as countries’ gross domestic product an integrated understanding of how these drivers connect to environmental with economic and biological variables for tuna stocks is currently missing.

Here we examine whether tends in tuna stock status, as measured by F/FMSY, are related to the economic and social development of countries (Human Development Index, HDI) to identify whether some countries are more risk of overexploitation. We then develop statistical models to explore how stock status could be affected by different types of short-term shocks based on the relationships between F/FMSY with economic fluctuations (e.g. fish prices and fuel price), social (fleet diversity/fishing activity – knowledge transfer) and climatic variability (e.g. North Atlantic Oscillation Index (NAO) and Southern Oscillation index (SOI)). Time series of economic, climatic and spatial indices were available for more than 23 years. As these indicators are potentially correlated, we constructed ridge regression models (see Methods and Materials) and used these to assess the sensitivity of F/FMSY for tuna stock to each driver of change.

I found their analysis as regards fuel consumption quite interesting:

Fuel price was also dominant predictor of F/FMSY across all stocks, with a 25% change in fuel price resulting in a 1.6% max change in F/FMSY, providing a positive link between the money spent and invested by a fleet, and the quantity of fish landed. Although this is a small increase and probably the offset effect of favourable frozen tuna prices and increases in technical efficiency, this can, however, have positive or negative effects on the stocks, i.e. such an increase in fuel price could have a large effect on the stock by reducing fishing mortality but quite the opposite effect from a drop in fuel price if not properly regulated. Either way, this substantial effect could be detrimental to the industry and the resource, or both. Many small-scale operators (e.g. the pole and line fleets) perhaps would have less opportunities for social change i.e. potentially a decline in fleet size or diversity (in terms of fishing areas and/or species) that could in turn have lasting effects in terms of food security for some coastal communities. Longlining for tuna is on average up-to four times more fuel intensive per ton of catch than purse seining but the difference is very much smaller than that in specific fuel consumption per ton of catch, because of increases in fish prices for the better quality product. With much of the industry worldwide supported by government’s subsidies for fuel (in the western central Pacific alone worth in excess of US$335 million), a price drop in fuel costs could lead to harmful and wasteful fishing practices. Therefore controlling fishing effort levels in the future via competitive fuel pricing and/or controlled market incentives such as encouraging the use of fuel-efficient technologies will be of great importance to global tuna fleets. In contrast, the species price effect resulted in a negative coefficient (both fresh (4%) and frozen (13%)), which is counter-intuitive to the expected behavior of fishers. Production sensitivities are usually positive; a higher price (Ceterus paribus) will lead to increased production. Although an elastic price effect of demand may occur whereby a moderate increase in catch will result in a substantial decrease in price. However, in the case of purse seine fishers, it may be that the fishers target a higher abundance of fish even if the price is lower, therefore with overall higher total benefit. Fresh and frozen prices were included in this model to capture the dynamics of the sashimi and cannery markets, but maybe at the time of fisher decision-making the difference in price between fresh and frozen may not be relevant and therefore a composite measure of price would have been more appropriate proxy. Further, the quantity of frozen tuna can potentially be controlled in deep freeze and the quantity adjusted to market demand. It is also important to note that the fishing mortality on most tunas has increased, which could also explain the negative effect.

Conclusion
Tuna represent an iconic aquatic species that are important to many nations worldwide, not only for employment or economic returns from fishing, but are socially and culturally integral to local coastal communities as well as for the ecosystem. Our analysis has demonstrated how correlated social, economic and environmental variables can be combined in a simple model that can help to assess vulnerability to overexploitation and thus allow time for preventable management action.

Fisheries management has progressed over the course of the 20th century, but given the large proportion of stocks that are depleted or over-exploited, the threat to many coastal communities, and the increasing number of marine species that have been lost or listed as endangered, there is still a clear need for improved management. Our approach is necessarily simplified in that we analysed trends relative to fixed references points from stock assessment outputs. In reality changes in stock structure and environment will change FMSY (and also MSY and BMSY). Future work could aim to address these influences in more depth by integrating environmental variables into dynamic population models.


Fiji's Parliament agrees to the FAO PSMA by Francisco Blaha

It has been talked for a while but now is official, Fiji's parliament has agreed to sign the FAO Port State Measures Agreement. In a stark difference from the other Pacific Island States that signed, Fiji is a busy Port state for the Chinese, Taiwanese  (either own or using Vanuatu flag) longlining fleet, with a big chunk of them fishing in the high seas.

She is going to be bussy!

She is going to be bussy!

Interestingly, as in the other cases, the drive to sign comes from the Foreign Affairs sector, more than from fisheries. 

In the case of Fiji, it would be interesting because it will take a big responsibility that is not reciprocated by the main DWFN that are using their ports: China (for lack of interest) and Taiwan (because by not being a member of the UN -  due to China’s opposition – it can’t sign, besides the fact that may not be interested in doing so anyway). 

Critics of this situation, may have point when they see it as (again) a developing Pacific Island Coastal and Port State taking an important responsibility (and costs) associated to PSMA, while the key Flag States (that subsidise their vessel way beyond the worst estimates of the value of IUU fishing in the region) keep not honouring their responsibilities over the action of their vessels.

In any case, Fiji has a solid MCS team I have worked over the years and is implementing many elements of PSM. And while I’m sure their work will be stretched by many of the additional components in the FAO PSMA, the signature also implies support to be provided by FAO in terms of capacity development and implementation. As usual, the more coordinated this work is with the existing work of FFA, the better for everyone. 

I have written in extent over PSMA over the years, and particularly under the principle that one size does not fit all... signing the Agreement is one thing, implementing it is a different game, and one that is exclusively lead by  the Fisheries Authorities (which in my opinion are vastly underresourced in the region), and not by Foreign Affairs, that sign and then go the next meeting..

And as I explained before, a lot of my PSM work in the region  is not explicitly aimed at implementing the FAO PSMA, instead, it seeks to achieve arrangements that are consistent with the purposes of the FAO PSMA so if a country decides to do so, a lot of the ground has been covered already. The decision to ratify the FAO PSMA or not, is the sole discretion of the governments, and that level of decision making is way above my pay level!

Working in Tuvalu on PSM, Transhipment Controls and Section 7 of the EU CC by Francisco Blaha

I have worked in quite a few places over my life, but hardly any get to the level of uniqueness of Tuvalu… While everyone was in Rome at what looks like a very successful FAO COFI 2018, the rest of the fishing world was just doing their jobs far from the limelight. In my case, I was working with my colleagues from the Tuvalu Fisheries Department.

Uni, Tuvalu's transhipment guru has all under control.

Uni, Tuvalu's transhipment guru has all under control.

There is plenty of info on the web about the remoteness and the challenges faced by Tuvalu, so I’m not going to repeat what is there already. But from the fisheries perspective, it punches above its category, so I was very much looking forward to coming back.

Dh8oLzZVQAApz7P.jpg

My job was to support the Tuvalu Fisheries Department with a combination of PSM best practices, Transhipment Controls and Section 7 of the EU Catch Certificates under a mission for FFA (and also because as you can see on the right has the coolest logo in the world – designed by a former compliance officer).

With PSM, of course, I mean Port State Measures, which are requirements established or interventions undertaken by which a foreign fishing vessel must comply with or is subjected to as a condition for the use of ports within a state.  

Tuvalu with 163 transhipments in Funafuti during 2017 and 99 up to date in 2018 has an important role as a major transhipment port state in the Pacific.

The objective of this work is not explicitly aimed at implementing the FAO PSMA, instead, it seeks to achieve arrangements that are consistent with the purposes of the FAO PSMA. The decision to ratify the FAO PSMA, or implement alternative PSM arrangements, is the sole discretion of the Tuvalu government, and those decisions go way above my pay level!

Tuvalu already covers the key elements regarding logistics, capacity building, institutional presence, control systems and IT support required to meet the need for PSM best practices and the EU CC expectations for transhipments. And while it has robust systems in place for vessels arrivals and inspections, as in other countries in the region only the essential PSM elements of information analysis before vessel arrival and the conditionality of port use and further transhipment monitoring wasn't clearly established. 

These essential PSM requirements are enhanced by the recent (Dec 2017) WCPFC PSM CMM  to which Tuvalu will need to abide at some stage, so the 1st part of the work focused on the standardisation of port entry clearance and the operational logistics of the process. 

A big part of the challenge is to adapt the ideal concepts around these best practices to the realities of the technology available in Tuvalu (particularly in regards internet bandwidth) 

The 1st part of the work is somewhat linear since only vessels licensed to fish in Tuvalu, under PNA arrangement and US Treaty are allowed tranship in Tuvalu, so this narrows the issues of vessels identity for us.

The process starts with the masters announcing the intention of port entry to TVF with 48 hrs notice, and this is happening as planned. The only addition we did is the date and port of the last departure, which allows narrowing the compliance analysis of the trip we are to asses prior the vessel arrival.

Differently to other parts of the world, denying Port Entry per se would hardly ever occur (as vessels need to be licensed to fish to tranship here, and fish landing are highly unlikely) yet some scenarios were incorporated in the soP.

Then we trained on the procedures for developing an Arriving Vessel Intelligence Report that would be used for the authorisation of port use. This document is based on assessing the vessels trip information based on information available to the Compliance officers through FFA RIMF and iFIMS. This check includes among others: FFA VoI, risk index and VMS track for the trip length, licensing for the areas fished, eForms information (when available) and eObs (when available in particular Gen 3 data).

These information sources provide the required intelligence, which along the compliance risk identification related to the type of vessel will determine the scope and depth of the inspection

The arrival is then listed in the port operations whiteboard (see below) and communicate the approval back to the master, and the boarding is scheduled, and the boarding logistics set up. 

A big part of port operations and PSM is to know what, when, where and who is doing what. The whiteboard is such low cost but a really useful tool that provides a snapshot of what is happening in the port to everyone in the office and the other agencies. There should be a total correlation of what happens in the lagoon and the wall… simple as that. I have set them up in many parts of the Pcific , and it does work. 

Below is the training example I use:

Example of a port operations white board, all names are ficticious, for illustrative purposes only

Example of a port operations white board, all names are ficticious, for illustrative purposes only

Anyway, when the vessel arrives, the boarding party brings with them the details of the intelligence report, these are typically around establishing where manoeuvring consistent with fishing activities (inferred by speed changes and the manoeuvring patterns) are in EEZ that correlate to licensing, suspicious stops with proximity analysis, and so on, and contrasting all these with the information in the on-board logbooks, records, and so on… (not going to spill all the beans here 😎

Point is that if all is clear and the legality of the catch established, then the vessel is authorised to tranship catch, otherwise they are not allowed to use port until the situation is cleared up and if necessary the affected parties, i.e. coastal state where the alleged problem took place and flag state sort it out, there also is a role for the port state to be involved on behalf of the parties… but believe me that "don't let a vessel tranship" and "don't let them leave" hurts the bottom line a lot… sometimes more than a fine!

When transhipment is authorised, we deploy “Monitors” on board, the monitors are usually “off duty” observers that get to supplement their earning while not at sea.  While these monitors are Tuvaluan observers, they report to the Compliance Unit and not to the Observers Unit for this type work. The functions of the monitors are

  1. Record estimates of catch volume and composition
  2. Record the presence of species of interest
  3. Record potential MARPOL contraventions
  4. Provide the data to the compliance unit

Now regarding weights, these were usually "estimated weights” based on the estimations of the weight in the “slings” passing from the FV to the carrier.

Wireless_crane_scale.png

Yet industry (mostly Korean vessels and some agents), are increasingly using crane scales such as the one in the image on the right. 

This option could be of particular interest to Tuvalu since their transhipment fees are based on charges per ton; therefore the better resolution, the better income, so over the near future we will be running a trial with these.

The set up is relatively straight forwards; port monitors hang the scale on the crane hook and switch it on. These scales have shock resistant steel frame and LED display, but most importantly a wireless remote control facilitates the weighing operations.

The remote control can send commands to the crane scale but most importantly monitors the scale’s status and displays the weighing information within 200 meters in line of sight.

Furthermore, many models have a non-volatile data memory of 1500 to 2000 weighing results and a summing function, all the necessary data can be transferred to a PC or tablet for further processing.

The equipment (to be owned by the TFD) can be carried on board before the starts of transhipment and locked to crane hook as a condition of transhipment. The remote unit can be used while the monitors are there or are locked away and keep operating while the monitors are not on board. 

The scale is “tared” by using putting all the cargo nets into one and weight them, and then dividing the total weight by the number of nets and using the average as tare (i.e. 10 nets come to a total of 80kg; hence the tare is 8kg). All the nets weighed are then “precinct” with a cable tire or some colour strings, and those are the only ones allowed to be used.

I have been proposing this setup, and I believe in it… It has quite a few advantages since it offers better data definition that relying purely on the logsheet (which impacts then stock assessments and management decisions), but I know that crew, captains and agents have a vested interest on this too… since wages depend on catch volumes, and as most of these loads would be only really “weight in” at the factories doors in Thailand or Vietnam in months time… knowing with better accuracy how much has been transhipped helps everyone.

Once transhipment is finished, the vessels (either PS and carriers) need to let fisheries know with 24 hrs their intention to depart as be cleared by the compliance guys. The clearance, besides checking on the conditions of vessels and observer, implies inspecting the wells and dry lockers for catch retained and not declared, if there is catch on board (some countries allow that others don't) then we record species and estimated volumes based on master’s appraisal, and have available on the system and record it in the vessels logbook, so the next port is aware.

In the case of Carriers, the departure procedure is a bit more complicated, since we compare the data for each of the Fishing Vessels that had transhipped to that carrier with our records and the mate's receipts and the pre and the post transhipment carrier’s hatch plan.

In case of differences officer investigates the reasons, and if those are not fully explained, it communicates with the Port Authority and stops the departure of the carrier until the differences are cleared. Otherwise, the vessels are free to go and gets off the whiteboard, and the data is all collected as to deal with section 7 of the EU Catch cert

Section 7 of the catch cert is a bit of a dog’s breakfast, to be honest… just when you read the section and It says “date” (like if transhipments are done in only 1 day) and “port of landing” while transhipment is actually defined (by the EU!) as in between two vessels, hence no actual landing is implied. Landing is putting the fish on land (and been corrected that is defined in the EU legislation CR (EC) No 1224/2009) ‘landing’ means the initial unloading of any quantity of fisheries products from on board a fishing vessel to land - Gracias Ignacio!) .

The term “port area” is also not defined either but the general view on this is that it refers to being around a “port” where an anchored vessel is approached by another one to transship. However, no official explanation has been given to date.

While not clearly explained in the regulations or manuals, this is the only part of the CC that requires the signature from the Port State instead of the Flag State. So vessels flagged in Country “A” tranship at a port in Country “B”. Country “A” is responsible for the validation of the CC, but country “B “is responsible for authorising the transhipment.

The transhipment can occur before the CC certificates are raised and validated (because in many cases there still no firm buyer for the fish) or because the fish has not been landed or processed at the destination which may or may not be the Flag State.

This a difficulty for the Port State as if they were to sign Section 7 at the time of the transhipment, they’ll sign an “empty” CC, with information provided by the captain or agent. Unless the Flag State is really “onto it” and able to provide a validated CC based on reliable estimates provided by the captain via the logbook and/or observers, prior the transhipment (there is no evidence of this ever being the case).

DG MARE in one of its notes proposes that the Port State signs the non validated CC; however this can be seen as a not showing sufficient due diligence by the Port State CA.

Alternatively, they need to keep the records of the transhipment authorisation on file, until such a time the processors of the fish that was transhipped request the CC from the Flag State who can then issue the CC which can then go to the Port State for section 7 signature.

In the original manual, the EU said that:

The EC would like to emphasise that at the stage of transhipment in port the catch certificate cannot contain information regarding the estimated weight provided in Section 3. However, all the other information provided in the Sections 2, 3, 4 and 5 should be made available by the shipowner/exporter.

Of course, we cannot modify any part of the EU CC, nor is our job to challenge whatever is written by the flag state in the cert, so we just keep all the records associated to the authorisation and request that the CC has Sections 2, 3, 4 and 5 complete

As it is now, in my opinion, the operational side of section 7 still requires either a level of jeopardy from the Flag State or from the Port State… and of course, my interest / work is to shield the Pacific island port states from any further problems with the EU.

Other than that, it was awesome to work with the solid crew from Tuvalu Fisheries Department, the officers are really focused and cool, their boarding boats are excellent and their attitude really positive and efficient. And it that wasn't enough, their new office is really nice.

L1060871.jpg

Furthermore, I'm very thankfull to them for being totally cool for allowing me to do this mission with my daughter, it has been very special for her... what I appreciate the most of working in the Pacific is that the importance of family does not need to be explained.

Not bad as a after work place to hang out every day...

Not bad as a after work place to hang out every day...

My 13 years old daughter Kika had a great time and loved the uniqueness of Tuvalu and its people!

Fakafetai Lasi Tuvalu.

Stretching out supplies of fish food to aquaculture species by Francisco Blaha

A lot of people normally tell me that aquaculture will "replace" fisheries, something that I usually dispute. Since many of the present commercially aquacultured species still depend on fish meal and oil for their feed. Hence in the best case scenario, they will complement each other. Yet aquaculture is not the only "user" of fish meal and oil, hence it "growth" also depends on the use by other food producers.

(left) Consumption of wild-caught forage fish by species groups, showing how pigs and poultry still consume large supplies. (right) The dominance of mainland China as a consumer of forage fish feed

(left) Consumption of wild-caught forage fish by species groups, showing how pigs and poultry still consume large supplies. (right) The dominance of mainland China as a consumer of forage fish feed

The intricacies between these users were researched by Halley Froehlich, Nis Jacobsen, Tim Essington, and their coauthors, in the journal Nature Sustainability. Below I quote in this paper as reported by the University of Washington SAFS.

Some types of aquaculture-raised (farmed) fish and crustaceans rely on wild-caught fish as feed for omega-3 fatty acids and micronutrients. But with the rapid and continuing rise of aquaculture, and the natural limits to the supply of forage fish (anchovies, herring, and their relatives), eventually this supply of feed will be exhausted.

This study now highlights ways in which the supply of fish food can be eked out further by:

  1. reducing the proportion of feed that is based on wild-caught fish and switching to crop-based diets such as soy;
  2. Increasing catches of forage fish to maximum sustainable levels, adding 30% more catch compared to 2012 levels;
  3. eliminating the addition of wild-caught feed to non-carnivorous farmed species;
  4. eliminating forage fish from pig and poultry diets;
  5. using trimmings from the processing of other wild-caught species as food for farmed fish; and
  6. Increasing the efficiency of farmed fish production.

These adjustments offer a variety of pathways to ensure that forage fish are able to support aquaculture growth beyond the year 2050.

(top) Total mass of food produced from pigs, poultry, and aquaculture species fed using wild-caught fish.&nbsp; (bottom) Dramatic changes over time in the use of fishmeal from wild-caught forage fish, showing how farmed fish are now the largest cons…

(top) Total mass of food produced from pigs, poultry, and aquaculture species fed using wild-caught fish.  (bottom) Dramatic changes over time in the use of fishmeal from wild-caught forage fish, showing how farmed fish are now the largest consumers of this feed source.

State of World Fisheries and Aquaculture (SOFIA) 2018 by Francisco Blaha

While I’m in Tuvalu to do some work on transhipments monitoring (and hopefully celebrate with them that their yellow card is lifted), most of the people I work with is at FAO HQ in Rome at the Committee of Fisheries biannual meeting in Rome #COFI2018. This is the biggest fisheries event there, and I was lucky to have participated in one while being an officer there. They are really informative events

mosty sustainable, but the unsustainable keeps creeping in

mosty sustainable, but the unsustainable keeps creeping in

A lot of work also goes in the publication of the biennial State of World Fisheries and Aquaculture (SOFIA) report.  Since 1994 @FAOFISH publishes it to provide a comprehensive, objective and global view of capture fisheries and aquaculture. Today the released #SOFIA2018 as part of the COFI activities.

no comments

no comments

This report is an Xray of where we at in fisheries worldwide (which does not mean that is the same case at every location, but rather a worldwide average). It is compulsory reading if you have a keen interest in fisheries and is the product of a mammoth effort by many of my former colleagues in Rome. The original and a very informative website are available here http://www.fao.org/state-of-fisheries-aquaculture/en/ 

A really succinct bullet point summary of its findings is below:

Screen Shot 2018-07-10 at 5.55.08 AM.png
  • Global fish production in 2016 rose to 171 mT. 88% (151mT) were used for human consumption (a record). Aquaculture contributed 53% of fish produced for human consumption.  
  • Per capita fish consumption grew to 20.3 kg in 2016. The highest consumption, >50 kg/year, is found in SIDS. Between 1961 and 2016, the average annual increase in global food fish consumption outpaced population growth by a factor of 2.
  • Global capture fisheries production was 90.9 mT in 2016 (79.3mT from marine capture), a small decrease from 2015, largely due to anchoveta, under the influence of El Niño. China, Indonesia, USA, Russia and Peru are the top producers.
  •  Average annual growth in aquaculture was 5.8% in 2000–2016. China has produced >50% of world’s aquaculture every year since 1991. In 2016, 37 countries produced more farmed than wild-caught fish- Collectively they account for 50% of the world’s population
  •  In 2016, global aquaculture production has been recorded for a total of 598 “species items”. In comparison, over 2,100 species are fished in the wild, demonstrating the huge biodiversity in aquatic systems
  • The fraction of marine fish stocks fished within biologically sustainable levels has exhibited a decreasing trend, from 90.0 % in 1974 to 66.9 % in 2015 (it was 68.6% in 2013). This threatens our capacity to achieve SDG14 targets 
  • The fraction of marine fish stocks fished at biologically unsustainable levels has increased from 10% in 1974 to 33.1 % in 2015 (it was 31.4% in 2013). The Mediterranean and Black Sea, SE Pacific and SW Atlantic have over 60% of assessed stocks fished at unsustainable levels
  • In 2016, about 35 % of global fish production entered international trade. Exports rose to USD 143 billion in 2016, 54% for developing countries – exceeding revenues for meats, tobacco, rice and sugar combined.
  • Loss or wastage between landing and consumption decreased but still accounts for an estimated 27 %  of landed fish.

Ideal Processing State Configuration by Francisco Blaha

Following on my post on the Ideal Coastal State set up for a CDS, I follow here the same principle but for a Processing State, based on what I wrote in our recent FAO book for a CDS and that I adapted a bit for the Pacific context for a report I have done for FFA.

Way more important than you think

Way more important than you think

The “processing state” concept is not yet recognized in international fisheries law – yet it is the most important state type in terms of country-level traceability solutions in support of a CDS.

While many Processing States are, by de facto, Port states, this is not always the case. Yet the responsibilities as a processing State are supplementary to those as a port State. The processing State can also be a part – or a specific form – of the market state, such as the end-market state in which products are consumed and from which they do not re-emerge in trade. 

For a CDS, it is important to distinguish the functions of the processing state from those of the port state and end-market state, so that functions can be assigned to a specific state-type overseeing transactions in parts of the supply chain under their purview, and to present them without repetition of each state type. In doing this, it must be borne in mind that any territory may be a flag State, a port State, a processing state and an end-market state concurrently. 

In simple supply chains (as in most of the Pacific Islands with processing industry) where the 1stbuyer is also the processor and the exporter, and no splits occur after importation, the CDS collects the information that enables tracing of the product. 

In more complex supply chains (such as the one in Thailand or Vietnam), where products are imported into national markets and where changes of ownership subsequently occur, are fully not traced by the CDS. This implies that exporters will be different from importers, which is where challenges emerge.

A CDS must be able to detect mass-balance violations at the country level – more product being exported than was imported – by means of certificates. But in complex national supply chains, where products under single certificates are split among several buyers, the CDS cannot establish what action, seller, buyer, processor or exporter is responsible for a mass-balance inconsistency detected at the time of exportation. 

The CDS can only detect problems with the balance of products intended for export, which may result from simple clerical error or from a laundering attempt somewhere in the national market system.

In complex national supply chains, which are the norm in advanced processing states, tools must be developed to trace the movement of products from the entry gate to the exit gate so that inspections can establish where anomalies occur and who is responsible for them. Without such traceability tools it may be impossible for a competent authority to establish the nature and cause of discrepancies.

Processing state authorities organization
The involvement of fishery authorities in processing is recent, and many older fishery regulatory frameworks are concerned only with fishing and landing, though a few require export permits largely for statistical and revenue-gathering purposes.

Processing is generally the preserve of food safety authorities, for whom traceability is important in terms of consumer safety, information and product origin. Such authorities already have data records, traceability systems and control structures in place.

Another set of fishery-specific controls with a different focus is therefore needed, which may be challenging in the processing environment. The focus of fisheries inspectors has hitherto been harvesting and landing operations, so their work often ends at the dock. But even trained fisheries inspectors who understand processing operations and can investigate company records, inventory systems and processing practices are limited in the range of their knowledge. It is therefore important that fisheries authorities collaborate with food-safety, health and customs authorities in joint working groups and inspections.

Authorization of imports
In a CDS it is important to differentiate between fish landed by fishing vessels and imports arriving through commercial ports, which may have been partially processed beforehand.

Requests for approval of importation should ideally be made before shipment and definitively before arrival. This enables processing states to establish the legality and acceptability of products in accordance with their system of checks and approval.

In most countries, importers must be registered for customs and tax purposes, and hence records are available. In some jurisdictions, only licensed importers under the control of the processing state are allowed to import seafood products against a set of requirements, that establish the identities of businesses and physical persons, ensure that records are maintained of inbound shipments, receipts, inbound lot IDs, lot splits and contact details of suppliers and buyers. 

Registration and licensing of storage and processing premises
Regardless of whether fish are imported or landed, in most countries fish storage and processing premises in the export value chain are licensed and under the control of health authorities; particular conditions apply according to type of processing.

Many of the license conditions refer to the safety controls, traceability of raw materials and market access requirements to be met for certification. An existing comprehensive traceability and record-keeping system at the industry level provides a favourable environment for CDS.

Four of the six PICs countries that have processing facilities are authorized to export to the European Union. Because of the EU system for granting seafood import authorizations, these states are in practice processing states, and traceability is hence part of their regulatory frameworks.

The authorities responsible for seafood safety in each country must guarantee that all operators in its supply chain comply with EU requirements, of which traceability is one. EU market access conditions require that all elements of the production chain under the control of the competent authority are uniquely identified and that all product lots are traceable at all stages of production, processing and distribution. This ensures that the components of the production chain can be tracked through lot splits and mixing.

Many of the KDEs reflect those needed in CDS. When implementing the EU regulation governing traceability and labelling, for example, the following data must be made available:

  • identification number of each lot;
  • external identification number and name of the fishing vessel;
  • the FAO alpha-3 code of each species;
  • the date of catches or the date of production;
  • the quantities of each species by net weight in kg or number of individuals; and
  • the names and addresses of suppliers.

An additional regulation requires the following:

  • the commercial designations of species and scientific names;
  • the production method – caught at sea, caught in freshwater or farmed;
  • the FAO sub-area where the product was caught or farmed;
  • the category of fishing gear used;
  • whether or not the product has been defrosted; and
  • the date of minimum durability, where appropriate.

With regard to regulatory control by processing states, the EU imposes controls to be followed by local authorities and food business operators to ensure that all production chain components are compliant with its rules. This establishes that the competent authority automatically carries out official controls with a frequency based on risk assessments. The controls can be imposed at any stage of the production chain.

Fish storage and processing premises involved in the export supply chain need to be licensed and under the control of the fisheries authority. Non-compliance with license conditions should automatically result in sanctions, enforcement measures and even suspension of the licence.

Control over distribution and transfers
Control by fisheries authorities over the distribution and movements of fish is critical in that the volumes declared must be identified, taking into account splits of lots and sub-lots along the distribution chain. It is hence important that transactions between licensed processors or cold stores are controlled and approved by the authorities.

Control of storage and processing premises
In principle, “processing” means any action that substantially alters an initial product. It can be as simple as transforming a fish from “whole” to “gutted” or “filleted” and includes changes by processes such as cooking, canning, drying and extrusion or a combination of such processes. In some cases “non-transforming” operations such as grading and packing are referred to as processing, but they have no effect on product or unit weight. By-products of processing such as guts, frames and heads should be included in national traceability systems because they are usually sold for pet food, rendering or fishmeal processing.

Because processing implies a change in weight from “unprocessed” to “processed” product there are opportunities for laundering by introducing IUU fish into processing and then declaring inflated processing yields or declaring deflated processing losses.

Fishery authority controls should ideally be established in two areas:

  • Cold stores and stock inventory. As previously discussed, in a CDS it is essential to identify the “ownership” of all stored raw materials and products, whether they are in processors’ premises or off-site storage facilities. Most companies have inventories that enable rapid identification of location, type of product, species, volumes and number of pallets, bins or boxes. Fishery authorities must regularly inspect processing establishments and cold stores to verify the accuracy of records and inventories, either jointly with the health authorities or under a Memorandum of Understanding that provides for action on its behalf.
  • Processing yields are critical in a CDS to enable estimates of the weight of product at different stages of processing. There are two important uses of yield factors: 
    • stimating the volume of round fish caught if on-board processing alters the original volume, this is particularly important as a catch-monitoring tool. Figures obtained from back-calculation can be cross-checked with logbook entries to monitor their accuracy and consistency; and
    • monitoring processing yields throughout the supply chain to ensure that laundering of non-originating material into the supply chain can be detected: this enables fishery authorities to detect non-originating materials being laundered as an operator processes unreported raw product into finished products, giving rise to unusually high processing yields.
  • Without the reporting and monitoring of yield factors, supply chains are open to fraud because laundering attempts cannot be detected automatically.

Dispatch
Health regulations require operators to identify and check products or raw materials to be dispatched and to record the details of what leaves the premises independently of destinations. Regular joint verifications by fishery and health authorities before dispatch and physical checks of consignments loaded are a simple way to ensure traceability and confirm that the correct volumes and species are recorded.

Export
In many countries exporters must be registered and licensed, and health certificates required by national or foreign markets and certificates of origin for trade and tariffs must accompany seafood exports. The issue of health and origin certificates must be carried out in compliance with the relevant regulations. The identification of consigners is essential.

These certifications include KDEs shared with CDS such as species, volumes, origin, and type of processing, so it is essential to work in coordination with health and customs authorities. Data can be verified against shipping and commercial documents such as bills of lading and insurance papers during validation of export trade certificates regardless of product category or degree of processing.


The four key rules of fisheries politics by Francisco Blaha

I have only done once work on recreational fisheries, this was over 13 years ago here in NZ… and it was a pretty toxic experience. Hence, I don't take sides in this (I think useless) fisheries debate… when both sides argue, it seems to me that they are very selective in cherry-picking their arguments. For me in fisheries, we all have to do better… end of story.

I'm a keen spear-fisher my self, but once I a while I don't mind burning lots of fuel to catch a few fish.

I'm a keen spear-fisher my self, but once I a while I don't mind burning lots of fuel to catch a few fish.

So when I read this paper in “Fisheries Research” but written by a member of the Canadian Sport Fishing Advisory Board, I was intrigued. Gerry Kristianson resumes the tone of his article quite well in the abstract:

Advocates for recreational fishing, public servants charged with fisheries management, and scientists and other experts who provide objective advice, all need to understand the nature and dimensions of fisheries politics. Accusing someone of “playing politics” usually is intended as a criticism, even an insult. But politics is the social process by which differences are expressed and resolved. If you don’t have differences, then you don’t have politics. A political situation, whether it is in a family, the workplace, government administration or a contest for public office is the process through which differences are discussed and settled. Fisheries politics takes place at many levels. It determines the resources available to manage fisheries and understand their impacts. It defines the relationship between conservation and extraction. It determines the allocation of harvest between competing interests. It sets the international rules between nations for the conservation and sharing of migratory and straddling stocks. Underlying these political relationships are rules and norms of political behaviour that can be learned and practised by those who wish to maximize their influence over how fisheries are managed and practised.

And while aiming to the industry vs recreational debate, his conclusion of four key rules of fisheries politics are of much wider applicability, and I wish people from the NZ recreational lobby all the way to the RFMOS were to remember them. I’ll resume my take-home messages but read the original here.

The four key rules of fisheries politics:

The resource must come first
Whether the discussion is domestic or international, my first rule of effective fisheries politics is to remember that the resource must always come first. The debate must be about ensuring sustainable fish stocks, not arguing about who gets to harvest the last fish. Anglers, like all other harvesters, must be conscientious participants in the collection of catch data so that there can be effective stock assessment.
Recreational catch statistics must pass the “red face” test as must an accurate understanding of the impact of angler encounters on fish that are not retained. Government fisheries managers, competing harvesters, and other interested parties must be satisfied with the accuracy of recreational numbers. While there will be differences in the way data is collected about the impact of hundreds of thousands of individual anglers as distinct from much smaller numbers of commercial vessels, there must be trust in the numbers.
Science is important – but must be understandable
A second rule of effective fisheries politics is to remember that while knowledge is essential to good management, the basis of scientific advice must be clear, understandable and relevant. Harvesters have a right to demand that jargon is kept to a minimum. It helps, when confronted by yet another set of numbers whose accuracy is being justified because the Bayesian statistical approach was applied, to remind the speaker that after his death in 1761, the Reverend Thomas Bayes’ comments on solving the problem of inverse probability were used as the basis for proving the existence of God! It also needs to be said that anglers can and should participate directly in science through things like DNA collection and the maintenance of detailed catch logbooks.
Politics is about people: civility is key
Politics is a human social process. Since its purpose is the resolution of differences between people it should not be surprising that civility is a key component. Treating others as you expect to be treated seems a simple maxim, yet frequently forgotten when politics devolves into ideological position-taking or when commonly held prejudices or preconceptions result in the pejorative description of other participants.
Demonizing other groups of harvesters isn’t conducive to reaching intersectoral consensus on fisheries management. Demeaning the role of conscientious public servants by disparaging them as “bureaucrats” isn’t likely to earn their trust or support. I choose to call myself a “Fisheries Politician” as a way of making clear to elected officials that I think politics is a noble calling and admire those who have chosen to put themselves forward for election and thereby are best able to claim they represent the public interest. It is their role to adjudicate between those of us who in a plural society have both a right and an obligation to advance our private interests through reasoned civil discourse.
Murphy is always around
Finally, it needs to be understood that politics, as a human social activity, is subject to circumstances that cannot always be controlled or predicted. The adage frequently cited as “Murphy’s Law” applies. If things can go wrong they usually will. An important lesson for anyone attempting to organize harvesters as part of a campaign to influence fisheries management decisions is that many of the potential participants would rather be fishing!
Now my brother Alex Blaha, he really is the ultimate recreational fisherman...

Now my brother Alex Blaha, he really is the ultimate recreational fisherman...

We are stuck with technology when what we really want is just stuff that works (D. Adams) by Francisco Blaha

Last Saturday I shared the stage on a discussion panel on New areas affecting trade – Value Chain Transparency during the FAO / FFA / SPC / NZMFAT organised "Pacific Regional Workshop for SIDS" in Auckland. It was an interesting event where pretty much everyone was my boss since I work for all of those four organizations!

maybe he is right... and that is what is all about..

maybe he is right... and that is what is all about..

A lot of the focus was on the new technologies and the surge of partial value chain (as not the ones that cover a whole fishery) initiatives particularly those based on blockchain architecture.

I have been a bit low in positivity later, which happen sometimes… when I feel that other than making a living for me and my family, there is not much that I (and the wonderful people I work with) are achieving.

My aims around common good, inequality, re-empowering the fishery resource owners, my sense of social justice, my belief in long-lasting fisheries that can help people to achieve a better life (as in my case) and so on… collapse when I see images like the one in the picture above. This is a young man waiting for a bus in Auckland a few days ago. Maybe what I believe is not really possible anymore and I live in a hippie past… 

I started my presentation with the phrase in the title because I really believe it contains a lot of wisdom:

“We are stuck with technology when what we really want is just stuff that works.” Douglas Adams, The Salmon of Doubt

I believe the traceability systems we design rely too much on ideal (and rich) people... yet the willingness of any player in the seafood value chain to be part of any system that adds transparency is based on the perceived economic benefits arising from its use and/or the fear of regulatory consequences of its "not use".  (Assuming the government agencies responsible have the mandate, willingness and capacity to enforce the rules, which does not seem to be the case in many DWFN)

The recognition (in our book) that Blockchain technology may eliminate the need for central registries and is therefore likely to reduce the complexity and cost of transnational traceability systems in a CDS is based on the obligatory nature of a CDS along the entirety of a value chain, from all the vessels, from all fags in a fishery, via all coastal, port, processing and market states those initial capture go to... OK, yes is ambitious, but I don't see another way, other than to have that regulatory imposition as the final objective of any CDS.

Independently of the programming architecture of the systems involved, the compliance functions enforced through a CDS central registry need to remain in place to identify fraudulent transactions in blockchain systems and environments. The difference between a central registry and a blockchain approach to CDS data is a matter of form, not function.

Any flow takes the path of less resistance, fisheries are no different... so why we expect the operators there to act differently than any other cutting corner business? An accountant that finds ways to save taxes to the wealthiest clients, is heralded as a champion, yet a fisherman that does in principle the same and plays with the rules with ut breaking them, is despicable... from an ethical perspective, both are equally as bad.

Hence, until there is a global commitment to value chain transparency tools like CDS (based on any technologies) we are just tinkering along the sides. 

By providing transparency to the value chain of responsible operators (who in reality did not need them in the first place - otherwise they would not have volunteered to be part of the pilot project), we are showing it is possible, but we are not solving the issue… the ones outside the systems being implemented are the problem.

For me, the big issue is that we have not formalised the incentives system by which the ethical and legal operators are rewarded and the non-ethical are punished by regulators and consumers*.

And that is not going to be changed by any App or traceability tool (Independent of the type of programming tool its used) implemented voluntarily by some operators or institutionalised only by some countries, while the competitor operators or countries (or the DWFN fishing on them) do not take part. 

* Finally, for me personally, the whole argument that the ethical consumer will reward the good practices and transparency with their choice or a price plus, maybe a truth for part of the 29% of the world population the earns more than 10 USD a day

Unfortunately, my life experience has shown me that "ethics" is a very shifty ground... But then, I have grown up and spent a significant part of my life (all the way up o migrating to a wealthy country) being part of the 71% that lived below that threshold… and I really could not afford to care.


New Zealand commits NZD 4.9 million to develop a CDS to control IUU in the Pacific. by Francisco Blaha

It has been a long-term coming but finally here! Thanks to NZMFAT and FFA (particularly by the combined work of my friends and bosses Joanna Anderson and Pam Maru!) this big Catch Documentation Scheme project has been given a green light.

My mate Matt (right) the new FFA DDG starts with a biggie!

My mate Matt (right) the new FFA DDG starts with a biggie!

The funding agreement was signed during the "Pacific Regional Workshop for SIDS" that I'm participating here in Auckland. In one way or another, the next few years of my work would be related to this project that is very close to my heart and expertise, but key for me is that run by very good people I trust and like.  

The FFA press release says:
In a move to enhance tuna fisheries management in the Pacific, the New Zealand Ministry of Foreign Affairs and Trade (MFAT) committed NZD 4.9million to the Pacific Islands Forum Fisheries Agency (FFA) yesterday.

This funding will be used by FFA to support a project that will establish and enhance catch documentation schemes (CDS) for FFA members over the next five years. The new Grant Funding Agreement was signed by Fletcher Tabuteau, Under Secretary for Foreign Affairs, New Zealand and FFA Deputy Director General, Matthew Hooper.

“FFA Members work collectively to effectively manage their Pacific tuna fisheries, and this project will support members to access high-value export markets while tackling illegal, unregulated and unreported fishing,” said Mr Hooper on accepting the funding support.

The project aims to ensure FFA’s Pacific Island members maintain market access for their fishery products, by improving traceability along supply chains through the integration of fisheries monitoring, control and surveillance systems, the implementation of electronic reporting and the development of technological solutions to strengthen national capacity.  

The project provides support for the development of national and regional CDS frameworks, national regulatory and policy frameworks and the development of CDS tools and associated training and capacity building.

The agreement follows almost two years of preparation and builds on work being undertaken to strengthen port state measures in the Pacific and complementing the existing comprehensive regional monitoring, control and surveillance framework implemented by FFA members.

IMG_0827.jpg

Ideal coastal state configuration by Francisco Blaha

Following on my post on the Ideal Port State set up for a CDS, I follow here the same principle but for a Port State, based on what I wrote in our recent FAO book for a CDS and that I adapted a bit for the Pacific context for a report I’m doing for FFA.

Is it your fish or mine?

Is it your fish or mine?

The rights and obligations of coastal states are set out in UNCLOS, but in most CDS systems their rights are not currently represented. Coastal states may have no role in the CDS, or they may have no capacity to object to the validation of catch certificates by flag states. It follows that catch certificates can be issued and validated by a flag state for catches in its waters even if the coastal state suspects infringements, and opportunities to address the issue with the parties concerned before unloading and first sale into the supply chain are hence denied.

The following requirements for good governance of fisheries in coastal states are generally recognized: 

  1. a strategy for effective fishery management; 
  2. adequate laws and sanctions; and 
  3. cooperation with the appropriate RFMO and other regional and international fisheries bodies, particularly when it comes to licensing and access agreements for foreign fleets.

For the Coastal States among the FFA membership, the harmonized minimum terms and conditions for access by foreign fishing vessels (HMTCs) facilitate this role. Provided a vessel meets the requirements laid out in the registration application including proof of a type approved MTU, a foreign fishing vessel in the FFA regional register automatically obtains a "good standing" status. Should it lose its good standing as a result of a violation of conservation and management measures of any FFA member, the vessel will be denied access to the waters under the jurisdiction of any other FFA member. This creates a powerful incentive for compliance.

In discharging their obligations with regard to fishing vessels, coastal states do not automatically act as flag states. Coastal states must, therefore, create tools and mechanisms that enable it to collect information from and oversee foreign fishing fleets operating in their waters. These must be part of a robust and cohesive regulatory framework implemented by a well-resourced and capable fishery administration.

Licensing and access agreements
Vessels operating under coastal state jurisdiction must be licensed and must comply with the responsibilities of license holders or operators with regard to national laws and conservation and management measures.

A common approach is to make access subject to agreements with flag states that detail the responsibilities of a flag state with respect to fishing by vessels flying its flag. Such agreements should at least commit flag states to penalise any of its vessels that violate the terms of access, and could also commit flag states to:

  • assist MCS work by coastal states;
  • make violation of coastal states’ fishing restrictions a violation of flag state laws; and
  • remit to coastal states any fines that flag states collect for fishing violations committed by its vessels in coastal state waters.

Access agreements of this sort can foster partnerships between coastal and flag states for preventing, deterring and eliminating IUU fishing. To be effective, however, any access agreement should only provide access for vessels registered in the state seeking access.

The FFA regional register recognizes that most fishing vessel operators wish to operate in waters under the jurisdiction of more than one FFA member. FFA members undertake to ensure that any access agreements they negotiate will include all the requirements in the harmonized minimum terms:

  • no foreign vessel will fish in a member state’s EEZ unless a standard licence is issued;
  • purse seine transhipments at sea are prohibited; they are permitted only in designated ports; longline vessel transshipments can occur at sea, subject to application and approval by the licensing state;
  • foreign fishing vessels must release logbooks and catch records to officers from the licensing state;
  • vessel operators must maintain and submit catch logs for operations in an EEZ and adjacent high-seas areas; these must be released to the licensing state within 45 days of any fishing trip;
  • vessel operators must provide regular catch records for the licensing state while operating in any EEZ;
  • vessel operators must carry observers to verify reports; they must have access to appropriate parts of the vessel and must record their observations;
  • vessel operators must maintain a local agent;
  • fishing gear must be stowed while transiting an EEZ;
  • vessel operators must comply with the orders of licensing states;
  • operators must mark their vessels in accordance with the FAO Standard Specification for the Marking and Identification of Fishing Vessels; and
  • vessel operators must register automatic location communicators on the VMS Register of Foreign Fishing Vessels.
  • Compliance to the HMTCs is discussed below in Section 6.3.1.2, yet two elements arise as best practices for PSM and CDS

Monitoring harvesting operations in the EEZ of coastal states
Before fishing starts the coastal state must create and maintain a record of authorized foreign-flag fishing vessels in waters under its jurisdiction, and ensure that they are controlled by their flag state. This process starts with pre-fishing inspections of the vessels by the coastal state authorities, either at the vessel’s home port, a port in a third-party port state or the coastal state.

These inspections involve checking a vessel’s ID and operational capabilities against the documentation presented for licensing. If compliance is proven, licences are issued and the vessel is bound by the licensing conditions, which may include:

  • communication of location and EEZ entry and exit times; and
  • VMS, AIS and logbook regimes enabling coastal state oversight using data legally submitted by masters in log sheets or e-Reports.

These capabilities enable coastal states to oversee the legality of catches in their jurisdiction. Their enforcement capacities, however, are limited when vessels unload in other jurisdictions with which the coastal state has no formal linkages.

Blocking certification capacity
Even though coastal states’ rights and duties are enshrined in international law, mechanisms reflecting their rights are absent in current CDS. The Pacific Island countries defended coastal states’ rights in international fora, not least because unilateral schemes affecting them directly ignore their rights and their natural role in certification and validation.

It is essential that coastal states help to determine which catch certificates can be validated on the basis of information they collect about foreign fishing operations in their EEZ – which is often available to them alone. A new mechanism is required, but it must be grounded in the monitoring by coastal states of foreign fishing operations in their EEZ.

When a commercial fishing vessel is nearing the end of its trip and the certificate is being logged on the CDS platform, all coastal states in whose EEZ the vessel has been operating should be notified that the certificate is being applied for. Some coastal states may be overburdened by the tasks of reviewing and verifying every catch certificate, and counter-validating them in real time to enable transhipments, landings and trade to proceed.

As Coastal States should be monitoring vessels that are active in their sovereign waters, there may be opportunities to tie the initial stages of the catch certification process by Coastal States to the zone exit notifications that are standard across the Pacific Island countries. This therefore could set a number of parameters that need to be tallied and verified by the Flag State, if individual further Coastal State verification is not possible in the busy Pacific administrations.

However, the best option is likely to be a system of “non-objection” with regard to validation of catch certificates by coastal states. In such an arrangement, catch certificates validated by a flag state for catches harvested at least in part in a coastal state EEZ trigger an automatic notification to the coastal state, which has the option of reviewing the certificate: if it has no objection within a set period of time, no action is required and validation by the flag state stands. If the coastal state suspects an infringement, however, it can block the certificate in the system, bring the matter before the parties concerned and investigate the suspected IUU fishing event. It is important in this system that more onus is placed on the Flag State to complete a robust assessment as part of the certification process, using all available data including available zone entry and exit notifications, observer and VMS data targeting slow speed events. 

Deploying a Fisheries Observer on a Purse Seiner  by Francisco Blaha

I've been back at my 4th (of 8) stints here in the Marshalls Islands for a couple of weeks now, and among the 20 elements of my work plan, one that is close to my heart is to work on an integral set of Standard Operating Procedures (SOPs) for Fisheries Observers who have been trained under the Pacific Island Region Fisheries Observer (PIRFO) program. 

Munua (from Tuvalu)&nbsp;logs in.

Munua (from Tuvalu) logs in.

Not an easy process... so far, we have identified 27 different SOPs over eight different sections (Training & Certification, Placement, Safety and Tracking, Debriefing & Assessment, Administration, Equipment,  Discipline and Electronic Reporting & Monitoring), but it is fun as I remember many issues of my past and I’m working in Majuro is surely the Fisheries Observer capital of the world! It must have the biggest amount of Observers (in relation to population) worldwide. Being a major transhipment hub (35 to 50 per month), there is a constant stream of Observers from all over the Pacific getting on and off vessels in Majuro lagoon.   

To deal with most of these guys is the job of Bernard Fiubala, the Observer Coordinator here in MIMRA (I’m working with him on the SOPs task). He is from the first generations of Observers here in the Pacific, he knows his stuff left right and centre, but what I appreciate the most is that he cares about “his” observers more than he likes to admit, I think. He is like their uncle actually!

Uncle Bernard (2nd from the left) and "his" observers (Meli the incoming, and Manua the outgoing), reviewing the accommodation with the 2nd mate.

Uncle Bernard (2nd from the left) and "his" observers (Meli the incoming, and Manua the outgoing), reviewing the accommodation with the 2nd mate.

I have accompanied him to do the observer placements as part of some of the inspections we do, but today I decided to document the process for our SOPs and as there is a lot of public interest on the observers, I thought I’ll share this process.

Before I dig deeper on this, let me clear up a couple of things in regards observer safety (and I recommend you read this article from the latest SPC Fisheries Newsletter by my colleague Tim Park, PSC’s Observer Coordinator). Here I quote a bit of it:

Observer’s dual data collection and monitoring role can isolate them from the captain and crew, their only company, sometimes for months at a time, if they are on the high seas. The Western and Central Pacific Fisheries Commission (WCPFC) has identified instances of observers being assaulted, prevented from doing their job, asked not to report an incident, or denied food, water and safety gear. There have been six observers lost in the Pacific Islands region over recent years due to accidents, undisclosed medical issues that were exacerbated by working at sea and even suicide. One observer was allegedly killed by crew members, and one death remains a mystery. These incidents have all occurred since observers were given the role of monitoring the closure of fish aggregating devices, catch retention and other compliance issues. Since the beginning of 2017, observers are all meant to be equipped with an emergency beacon and two-way communication device in order to stay in touch with their agency. This is an important first step; however, the accidental loss of an observer in 2017 resulted in the implementation of a regional regulation on observer safety with obligations in relation to search and rescue and the treatment of observers who are placed on the fishing vessels.

Unfortunately, we had six deaths of observers in our region since 2010, which no doubt is six too many. 

I think it is important to put things in perspective. We have more than 820 active observers working across 15 observer programmes in Pacific Island countries and territories (PICTs). In Majuro alone, we have around 300 placements a year just from here... on a yearly basis pacific-wide there are an estimated 2000 observer trips in Purse Seiners, approximately 700 on LL and 10 on P&L. 

pastedImage.png

Even if we were to assume only 1000 trips a year (8000 over 8 years) that gives us a 0.075% fatality rate, which is very low. Particularly taking in considerations that fishing is the most dangerous job in the world, and pretty much everything on board can hurt you. I think there is a misconception that observers are sent to a type of war zone, that is not the case.

Please don't get me wrong here, and I’m only speaking on a personal capacity and I’m not dismissing in any form or way that there could have been sinister motivations behind each of those 6 unfortunate deaths, but then I don't automatically assume them either.

I have spent a lot of time at sea in fisherman and observer roles and I believe personal risk management has a strong cultural and “type of life” component. We do stuff in fishing boats that people from other industries will not do. I have done stuff that I would not do today and, in many cases, I was fortunate not to get seriously hurt

Think in your own societies as well, "city kids" were cautioned about play with us "farm/bush kids" because we were to “wild”. My wife is North European and cringes (surely with reason) at my lack of safety precaution when working with heavy machinery or chainsaws, which I don't see it because I have done the work many times before and I think I know my limitations, yet she sees it differently, which is also fair. 

Add to that, youthful exuberance and in many occasions, the fact that the “young me” and many of my Pacific friends, when you go on board you are away from your family or village “contention”, and no one is putting too many limits on your behaviour.  Anyway, my point is when things go wrong on board… they go seriously wrong.

Then there is the elephant in the room: alcohol. One of the biggest killers in our societies, and the Pacific is no different. Personally, I’m not really into alcohol, nothing religious or moral about it. It is just that I don't like it and I don't have to go far into my family history, to see how otherwise charming people transform themselves into irresponsible and violent individuals when they are drunk. 

In fact, under the “macho” culture of fishing prevalent when I was in the boats I learn that it was easier (and safer!) to say “I don't drink anymore”, that to say “I don't drink” and have to explain and aggravate people, since they feel judged. Unfortunately, we live in a society where in some respects, an “ex-alcoholic” get more social acceptance than a “non-drinker”.

And yes! We can argue that is that the alcohol may be given to the observer by the crew and/or officers and that is wrong, yet the observer may also drink that alcohol while on duty, and that is also wrong.

Therefore, I’m VERY happy that a zero tolerance for alcohol while on board has been drilled into the vessels' master and the observer during the whole placement and briefing process. And more importantly, the fact that they have a 2-way communication tracker (like this or this) with an SOS feature that can be used if they feel their safety gets compromised. (This is part of the array of fisheries Apps we use in the Pacific)

But let's go back to the placement process. A purse seine observer may be on board for 1, 2, or 3 trips, depending on the length of the trips. Every time a new observer comes on board, a formal briefing and placement process takes place, there is no way around that.

While the programme under which the observer is placed depends on national, bilateral or multilateral agreements, the process is totally standardised for all of them. The Observer coordinator comes on board with the observer, introduces themselves and the observer to the master and an early priority is to the check the accommodation where the Observer will be sleeping, they asses from physical space, condition of the mattress (bed bugs), security of storage area, allocated life jackets, etc. 

From there, it is off to the bridge where a 3-page checklist is reviewed and discussed dealing with matters ranging from access to safety to communications with the shore, to food and privacy. Describing the rights and obligations of both parties and each element is initialised, then signed by all the involved and then stamped by the captain. And of course the no alcohol rule is reinforced every time!

Captain agrees (and makes himself responsible) to 3 pages of conditions.

Captain agrees (and makes himself responsible) to 3 pages of conditions.

Then the Observer either stay of goes back to land and returns prior departure, the vessel is not cleared if the Observer is not on safe on board. 

Over the years I may have accompanied maybe 70 to 80 placements and I have yet to see a hostile one. The PS captains are very used to the process and the observer presence is part of the deal.

Most purse seiners have good living conditions, of course, the newest ones being more comfortable. Food can be an issue if you are a bit close minded about it, really depends on the nationality of the cook and the officers… in my opinion, Spanish, Japanese, Korean and American vessels (as in pure American and not Taiwanese/American) have the best food.

Once on board, you need to find your way into what it a close-knit "society". In my case; I’m helpful by nature, and that has always been good to me while on board. I had the advantage of have been a fisherman, so I know when and where I could help safely during manoeuvring before and during fishing, and in general terms, a helpful guy is always well received, the crew like keen people. 

The other thing that helped me a lot (more than I ever thought possible!) is that I’m a keen baker and I like making cakes. Western type cakes are not very common in Asian cuisine, yet they are liked. So I would board with a couple of cake moulds (today they are made of silicon so is easier) and some essentials; cocoa, vanilla, icing sugar, baking powder, but nothing major.

The key is working around the cooks always busy schedule, and he will be happy, the crew get really happy about it (everyone likes cake) and honestly, it doesn’t take me much of an effort. I had it as a weekly event, and the guys were already looking forward to it.

Of course, as in life, there may always be someone that for whatever reason does not like you and it is perhaps best to ignore that. Plenty more appreciate you putting a bit of an effort. The good thing about this is that it does not interfere with the work done or put you in any conflict of interest. 

I have written many times before that I have total respect for the job Observers do, they are a key cornerstone for vital data collection for effective fisheries management. Many of the people I respect in the fishing world were observers at some stage and that shows as soon as they start talking.
Personally, I would love to see more observers transitioning into fisheries officers in the Pacific, there is an untapped potential of insider knowledge there that we all could benefit from, while giving the experienced observer a path into the broader fisheries world.

Have a good trip Manua!